



8. TREND GRAPHIC AND BENCHMARK
8.1 Trend Graphic
Trend Graphic plots selected tags over time. Choose a saved trend (or create one in Development › Trend Graphic), then switch between line, bar, pie, area and box plot views. Values are sampled every second while the page is open.
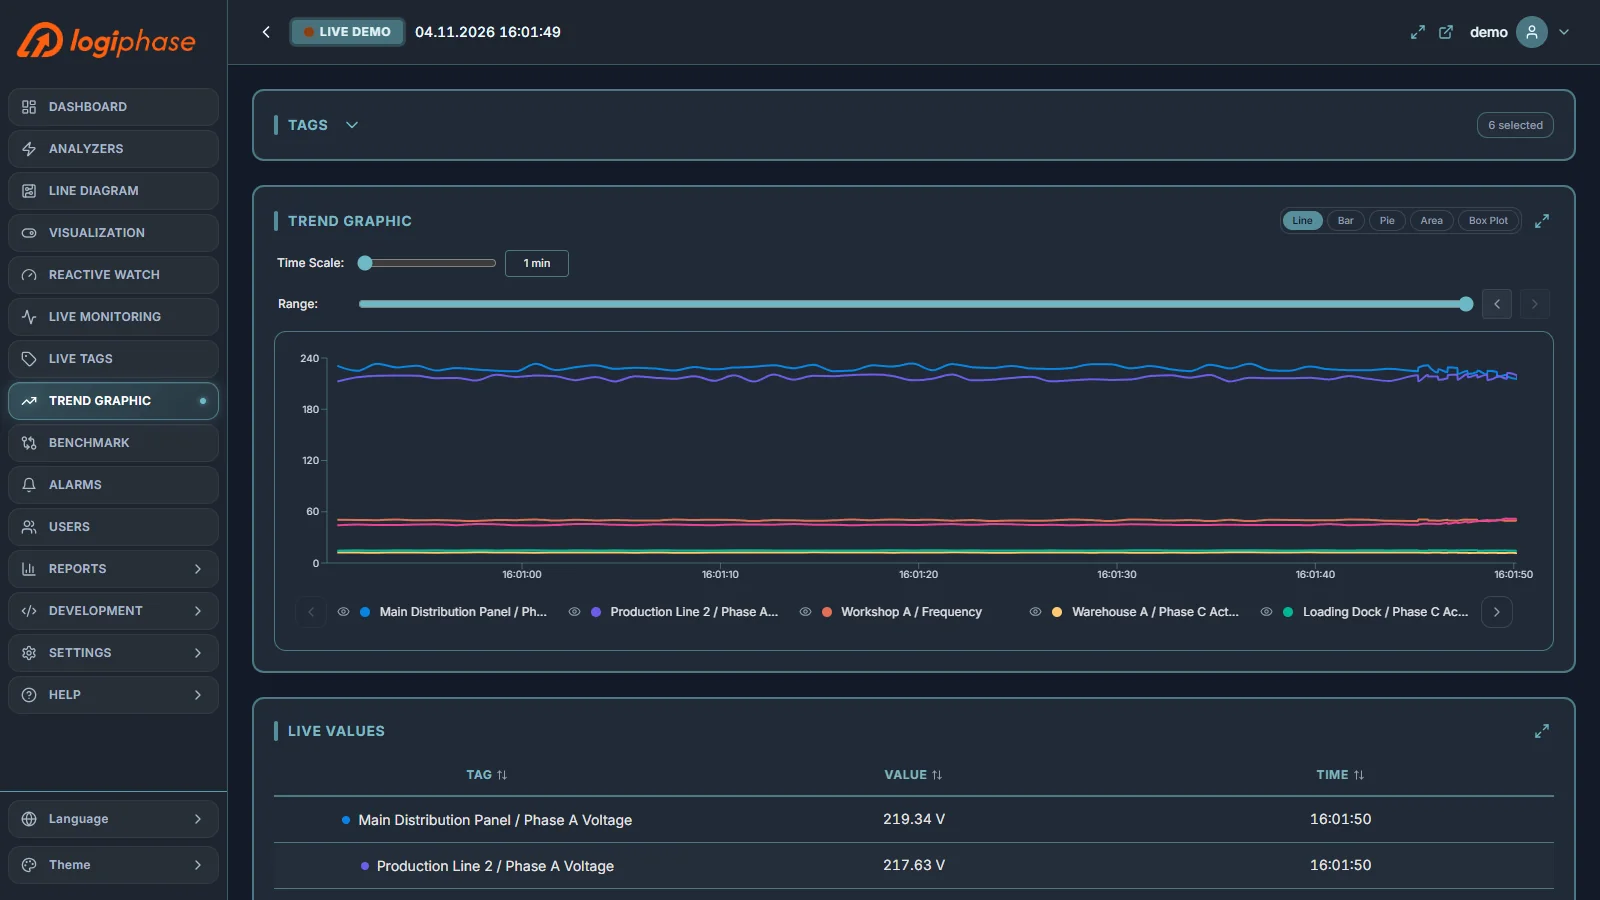
Adjust the time scale, move backwards or forwards in time, and use the legend to show, hide or isolate series. The Live Values table under the chart shows the latest value and time of each tag.
8.2 Benchmark
Benchmark compares analyzers side by side. Summary cards show total active power, total imported active energy, total cost and how many analyzers are online.
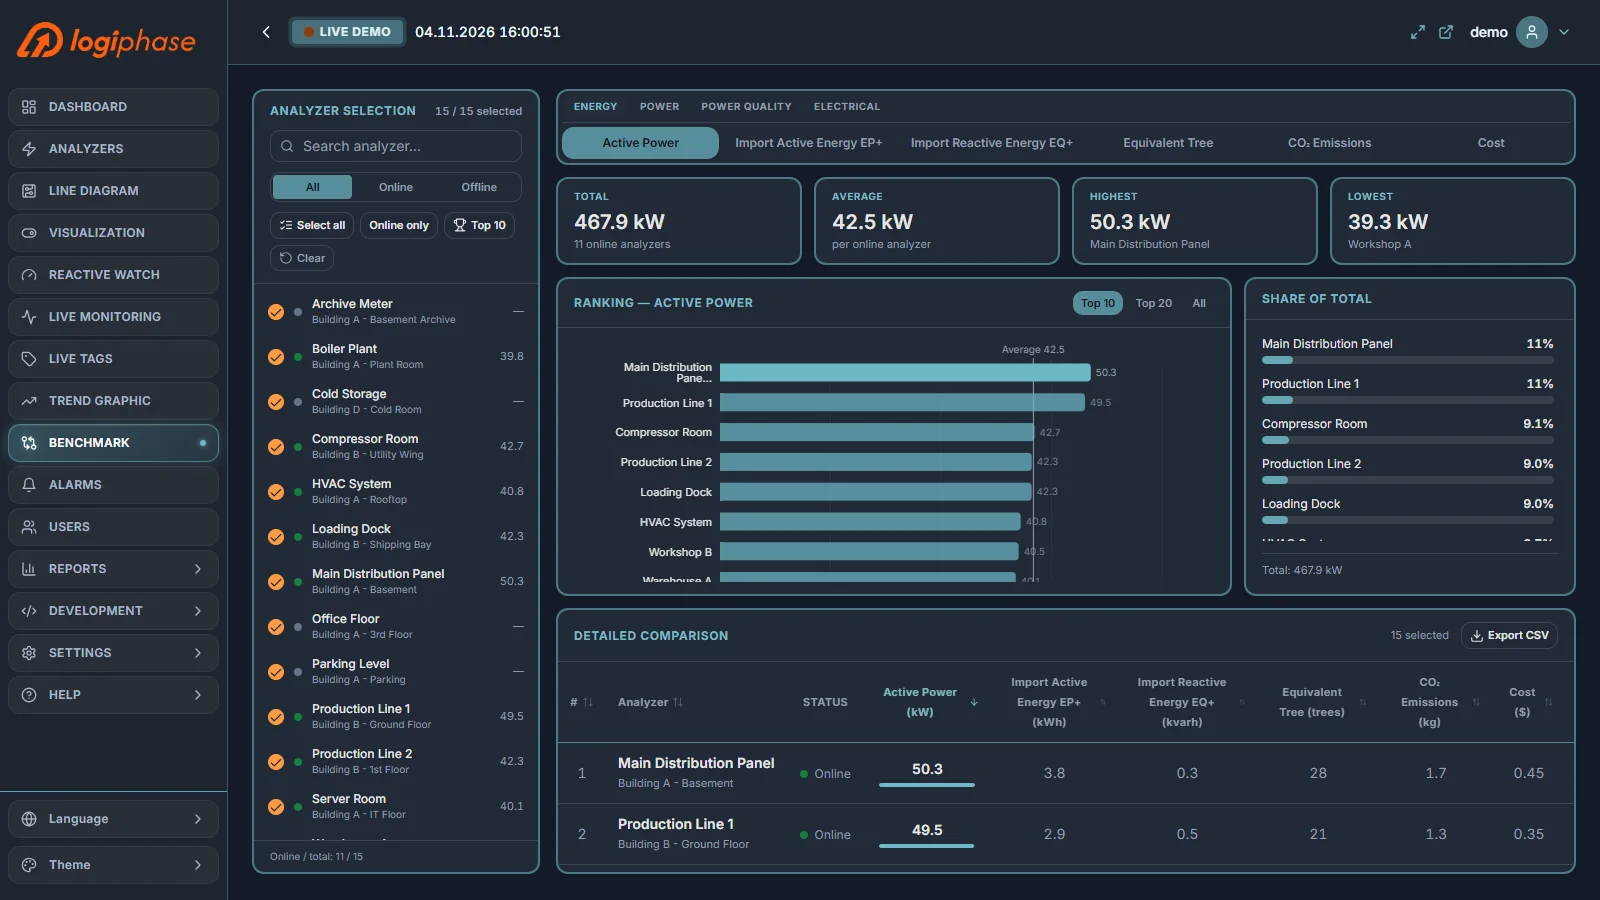
Select a metric — active power, imported active energy EP+, imported reactive energy EQ+, equivalent trees, CO₂ emissions or cost — and the analyzers to compare. The bar chart ranks them, the radar chart compares up to six online analyzers across all metrics, and the detailed table can be sorted by any column.