

10. CONFIGURATION
The Development menu holds the configuration of the project; Settings holds the tariff. Changes made here are applied by the Logiphase server.
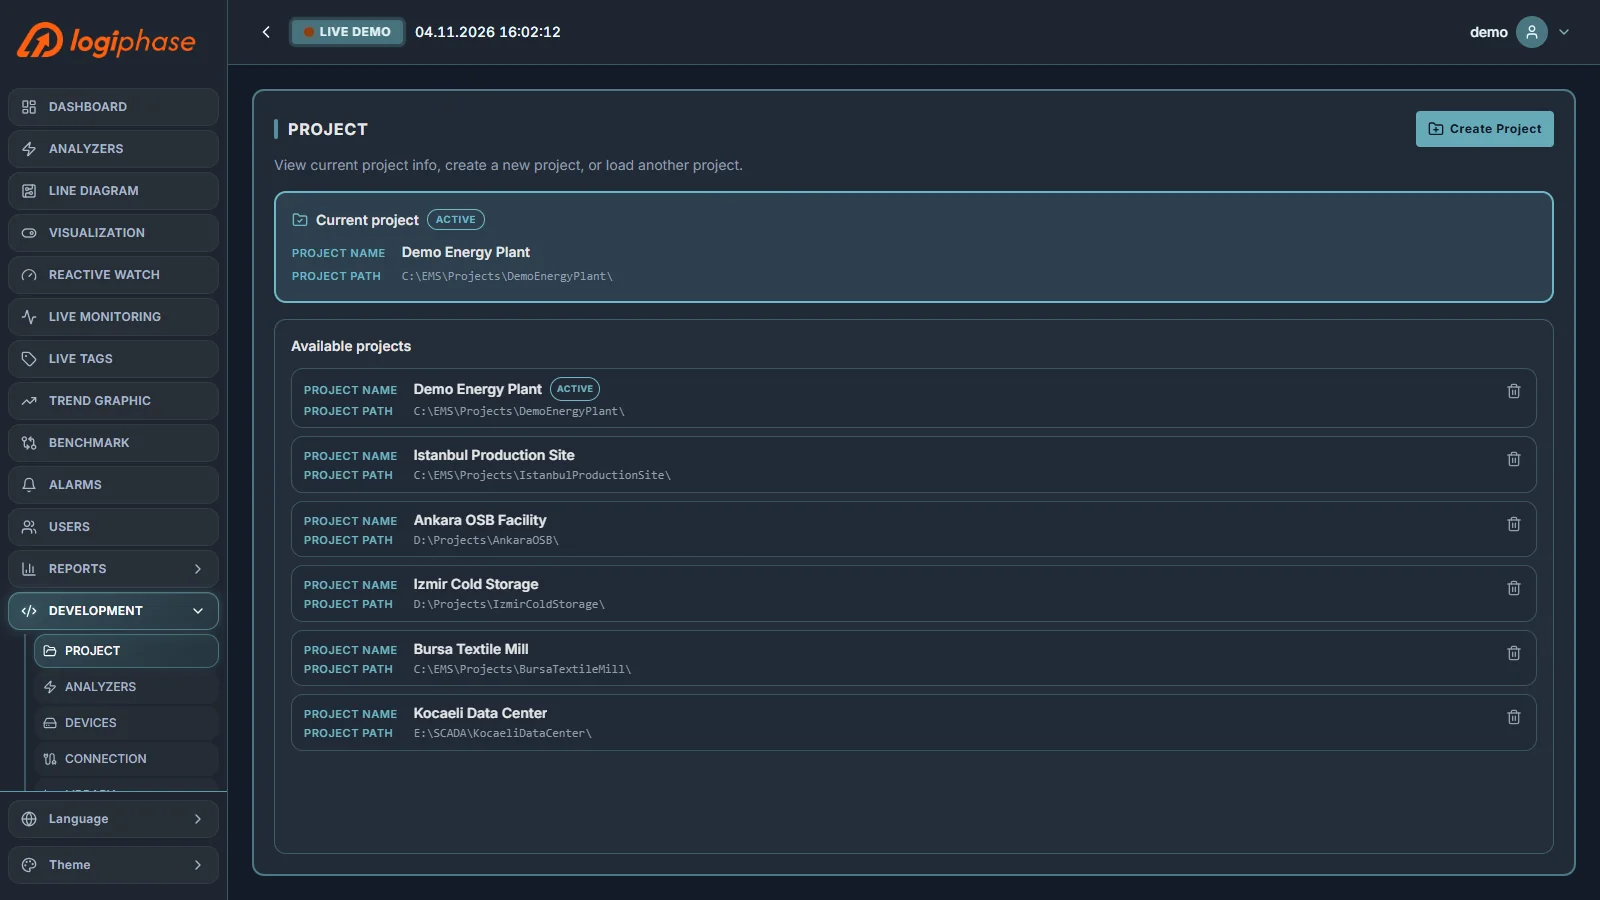
10.1 Project
A project holds the complete configuration of a site. Each project has its own database; create a new project or switch to another one from the project list.
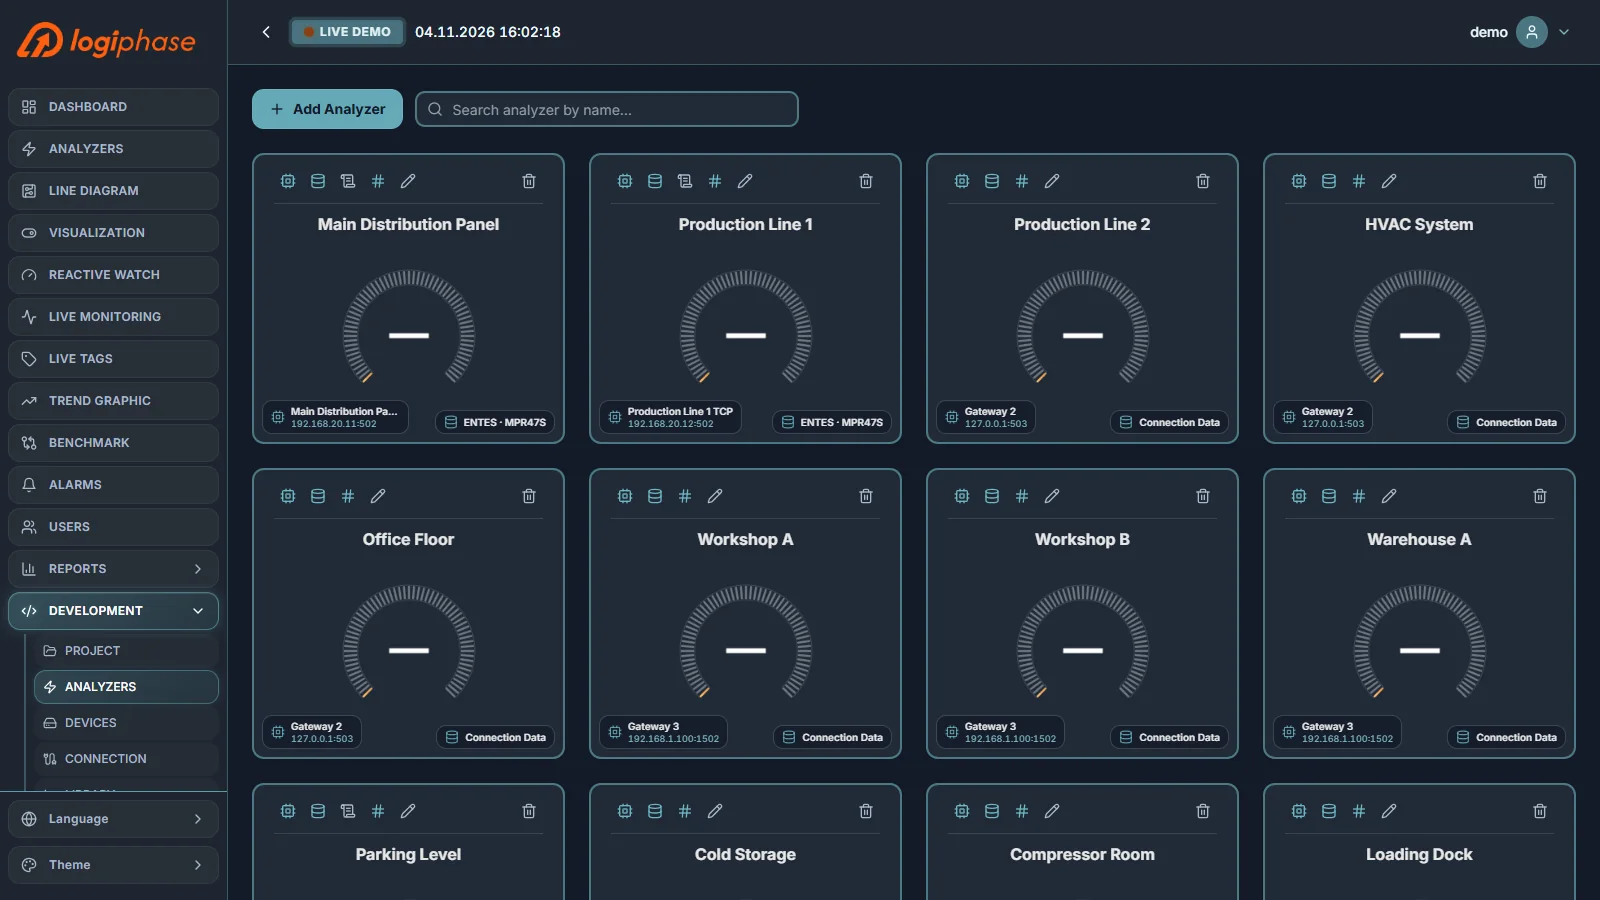
10.2 Analyzers
Add the energy analyzers of the site, name them and link each to its device. The analyzer's measurements are taken from the device model in the library.
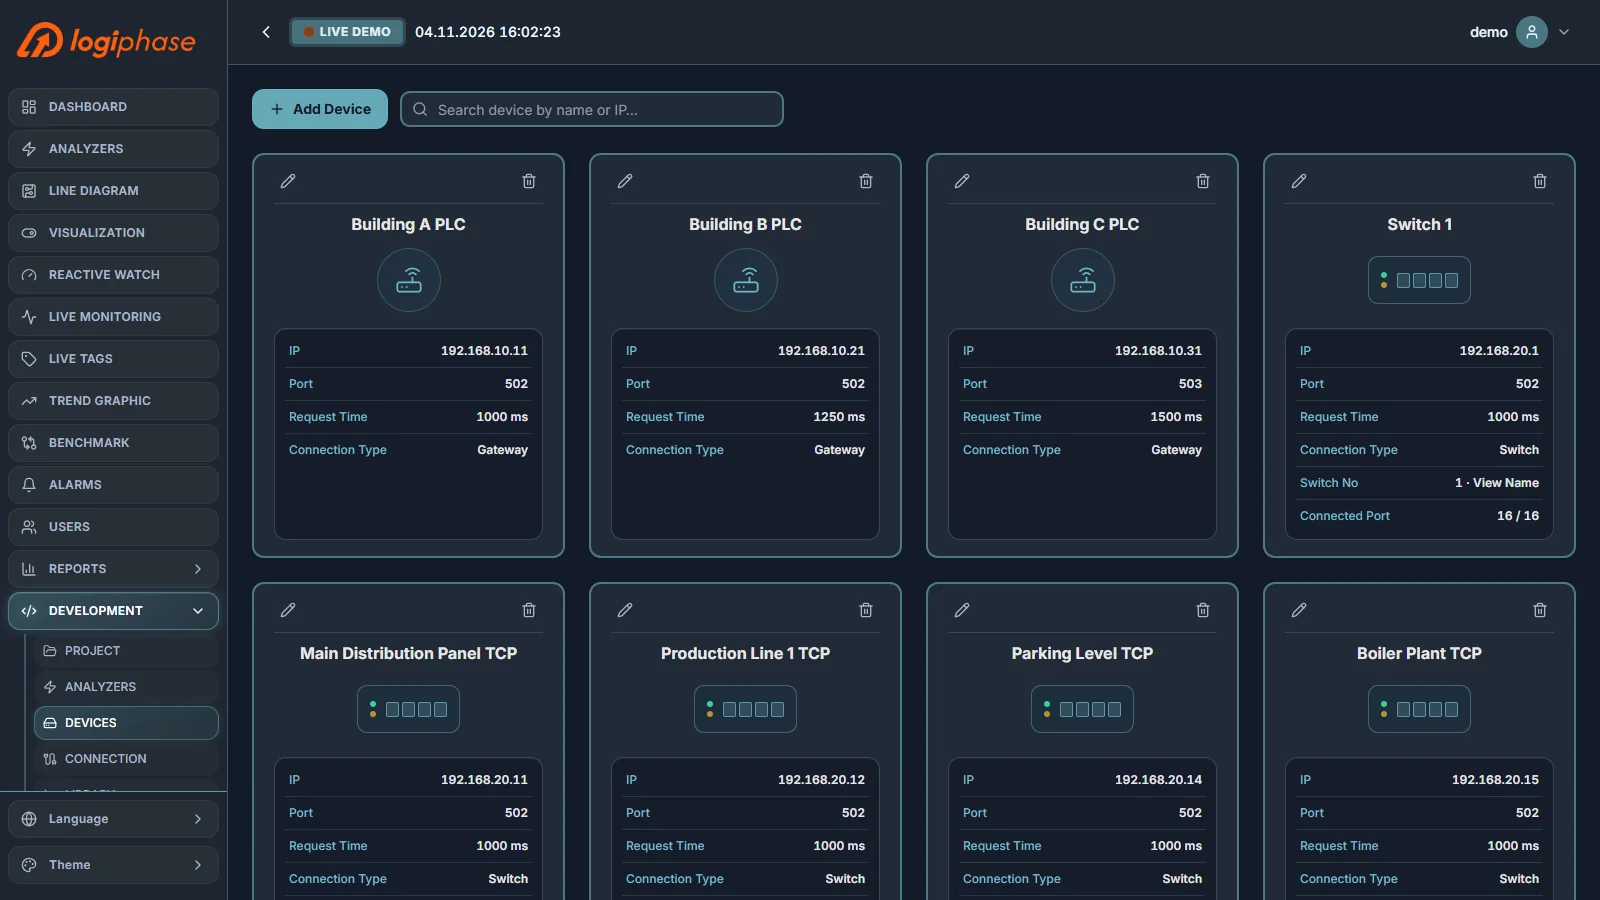
10.3 Devices
Devices are the gateways, switches and meters the server communicates with: IP address, port, request time and connection type (through a gateway or a switch, up to 62 ports). The Line Diagram is drawn from this structure.
10.4 Library
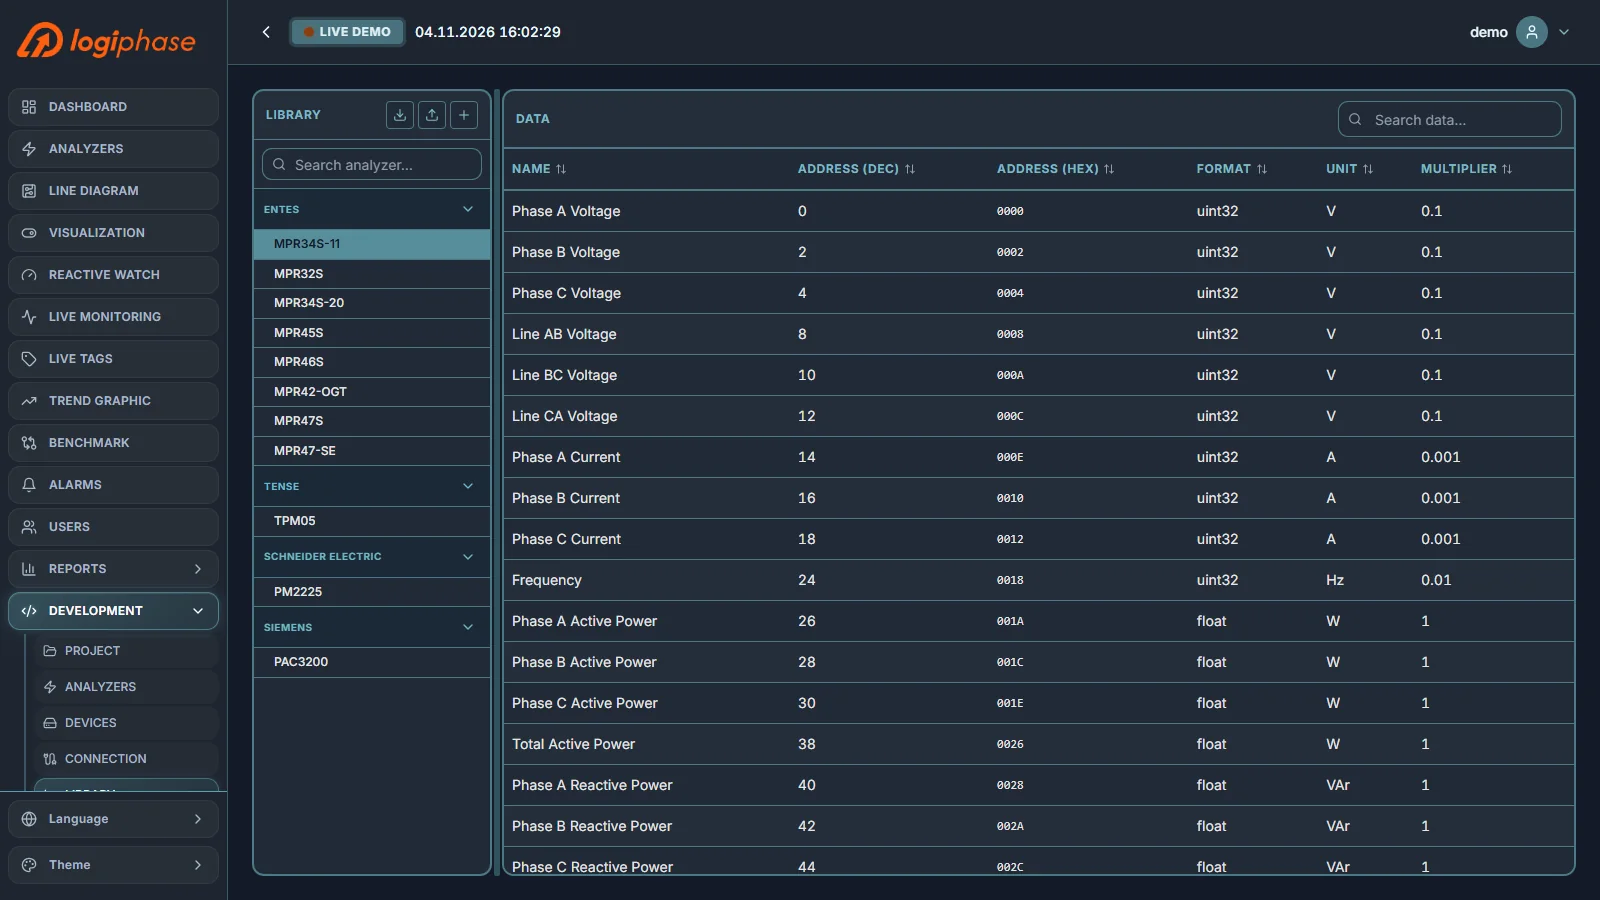
The library holds the register maps of analyzer models. Built-in models include ENTES MPR32S, MPR34S-11, MPR34S-20, MPR42-OGT, MPR45S, MPR46S, MPR47S and MPR47-SE, TENSE TPM05, Schneider Electric PM2225 and Siemens PAC3200. Add your own models for other devices, and import or export library models with Excel.
10.5 Connection
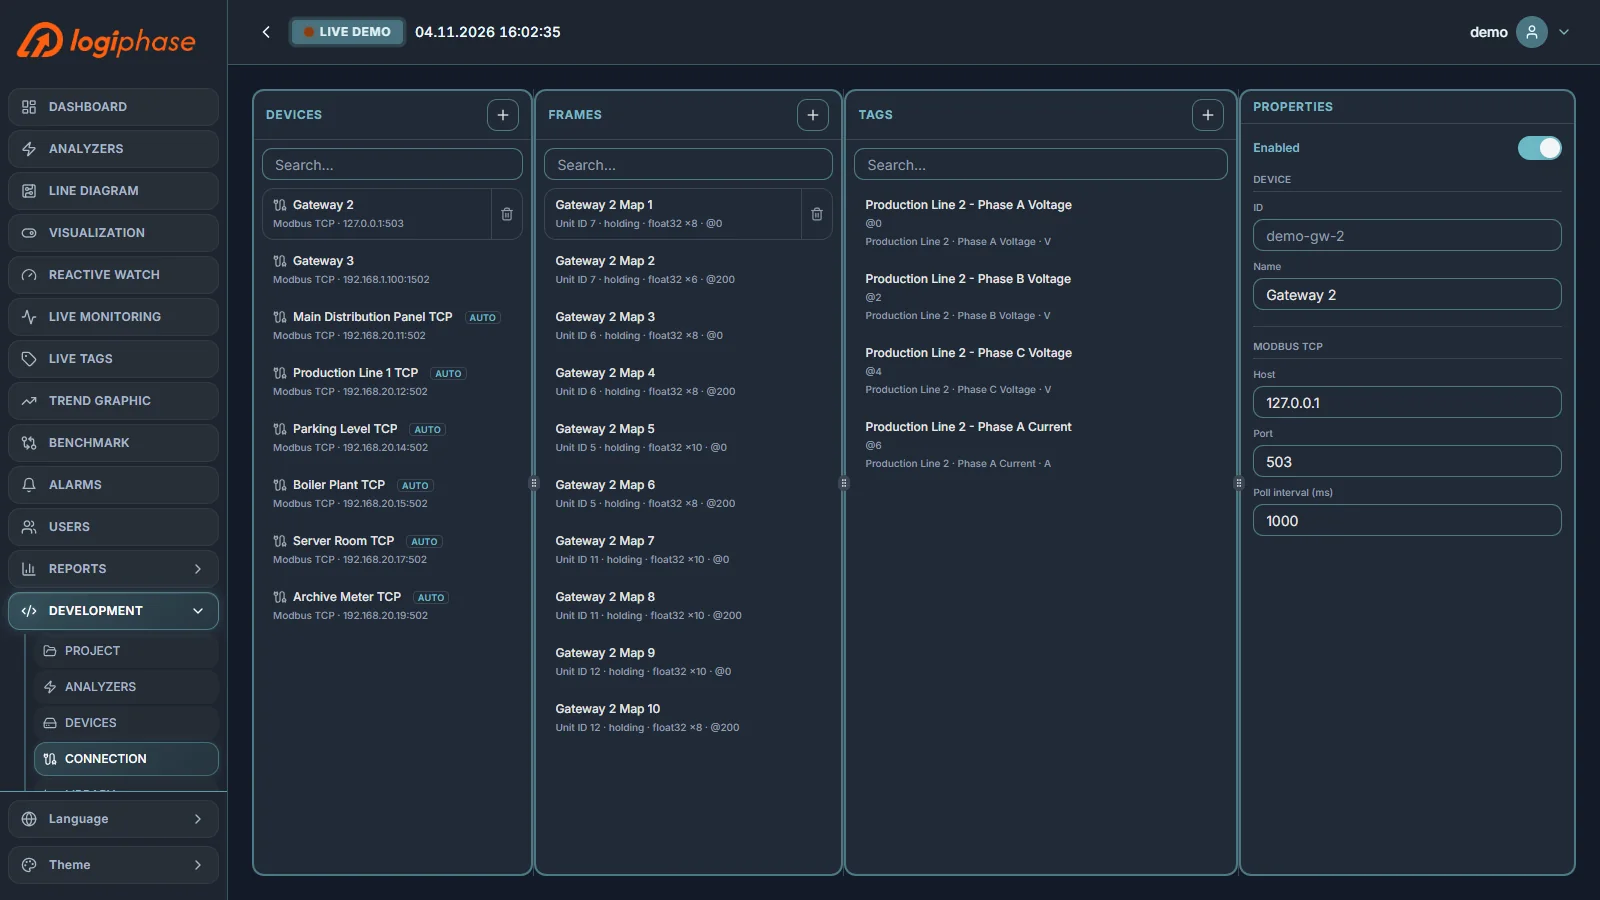
Connection defines how the server reads the devices over Modbus TCP: frames (blocks of registers read together) and their tags with register address, data type, scaling and unit. Function codes 1 to 4 are used for reading, 5, 6 and 16 for writing; data types include 16, 32 and 64-bit integers and 32 / 64-bit floats, also word-swapped. The polling interval can be set between 500 ms and 60 s per device. For each tag, choose its log status: no logging, periodic, or on change with a deadband.
10.6 Alarms
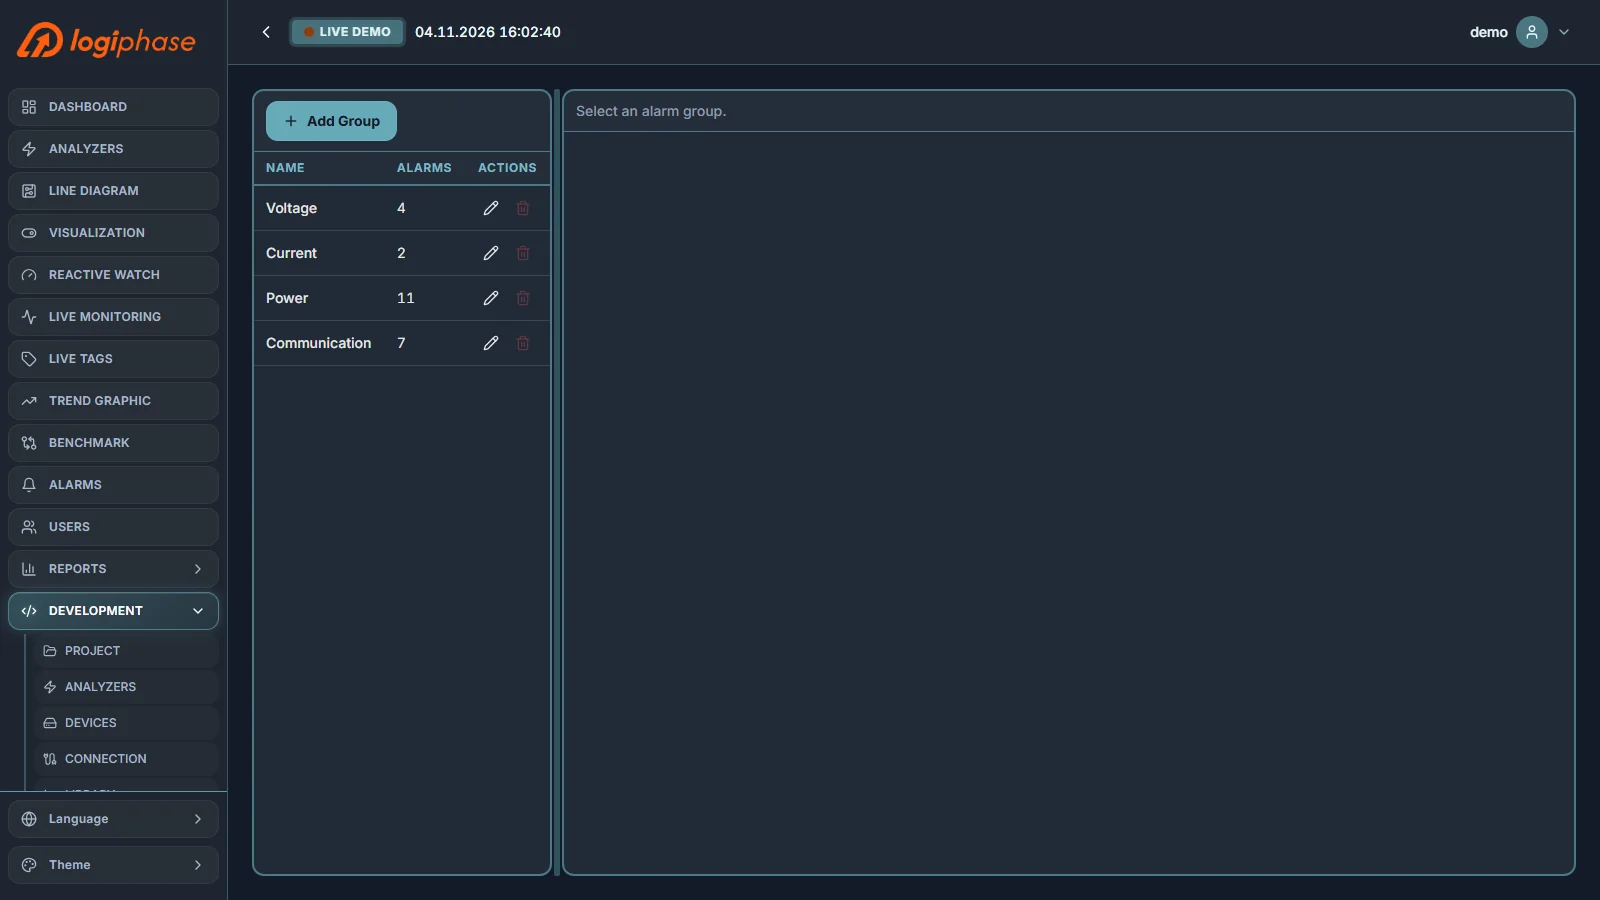
Create alarm groups and the alarms in them: the measured value (voltage, current, frequency, power, energy, communication loss or any analyzer value), the condition (greater, less, greater or equal, less or equal, equal, inside or outside a range), the severity (critical, warning or info) and the colour.
10.7 Reactive Penalty
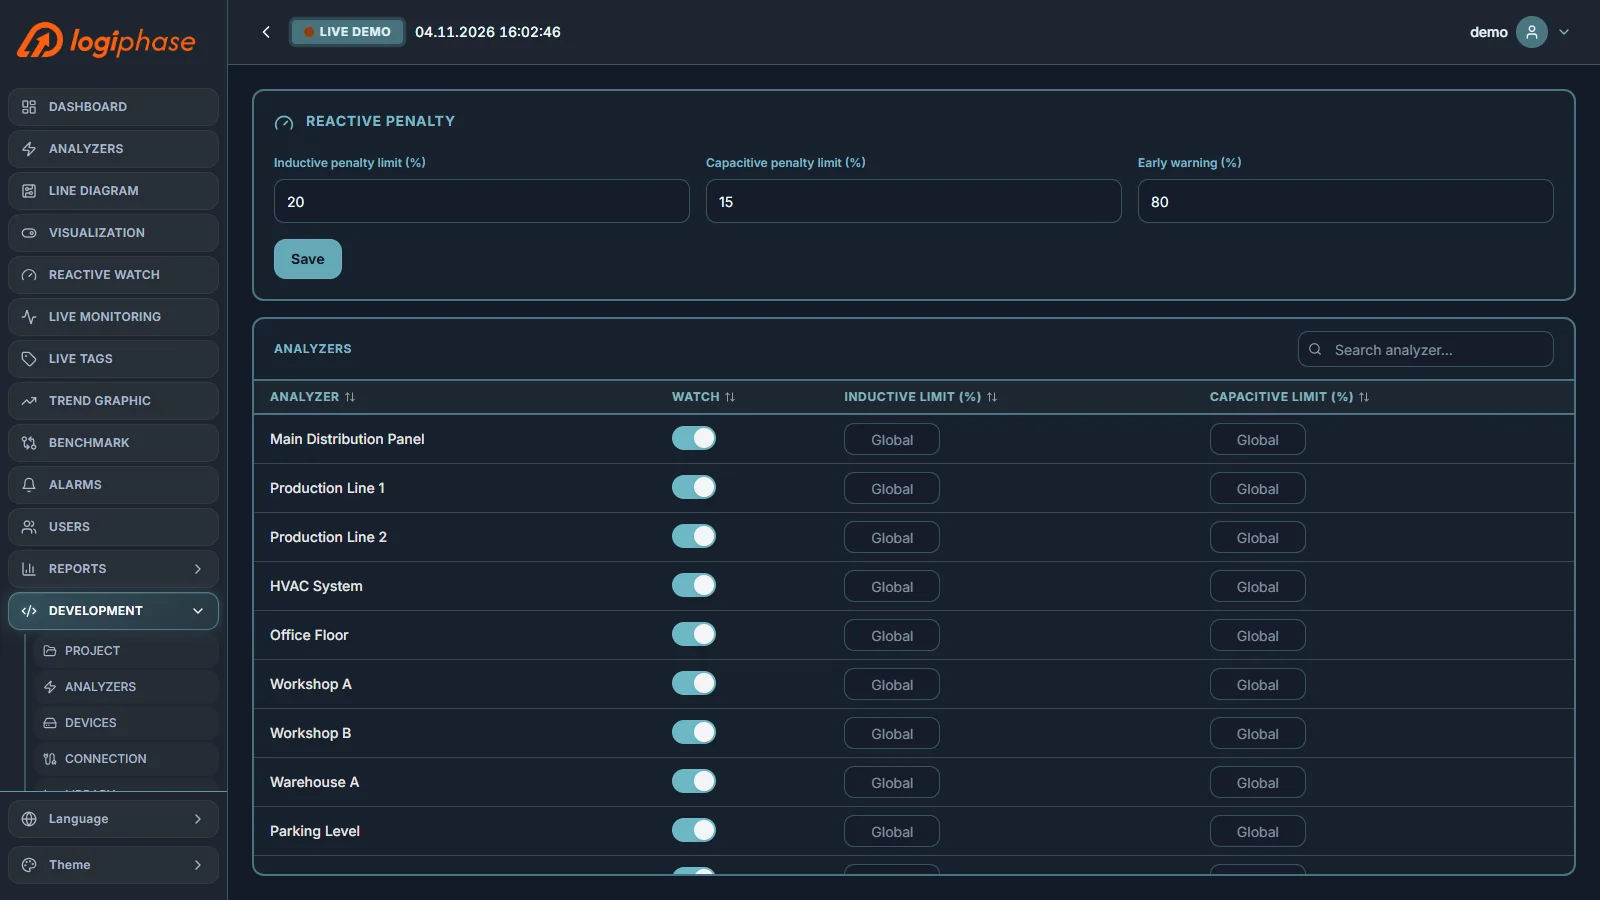
Set the inductive and capacitive penalty limits and the early warning level used by Reactive Watch, enable watching per analyzer, and give an analyzer its own limits when they differ from the site.
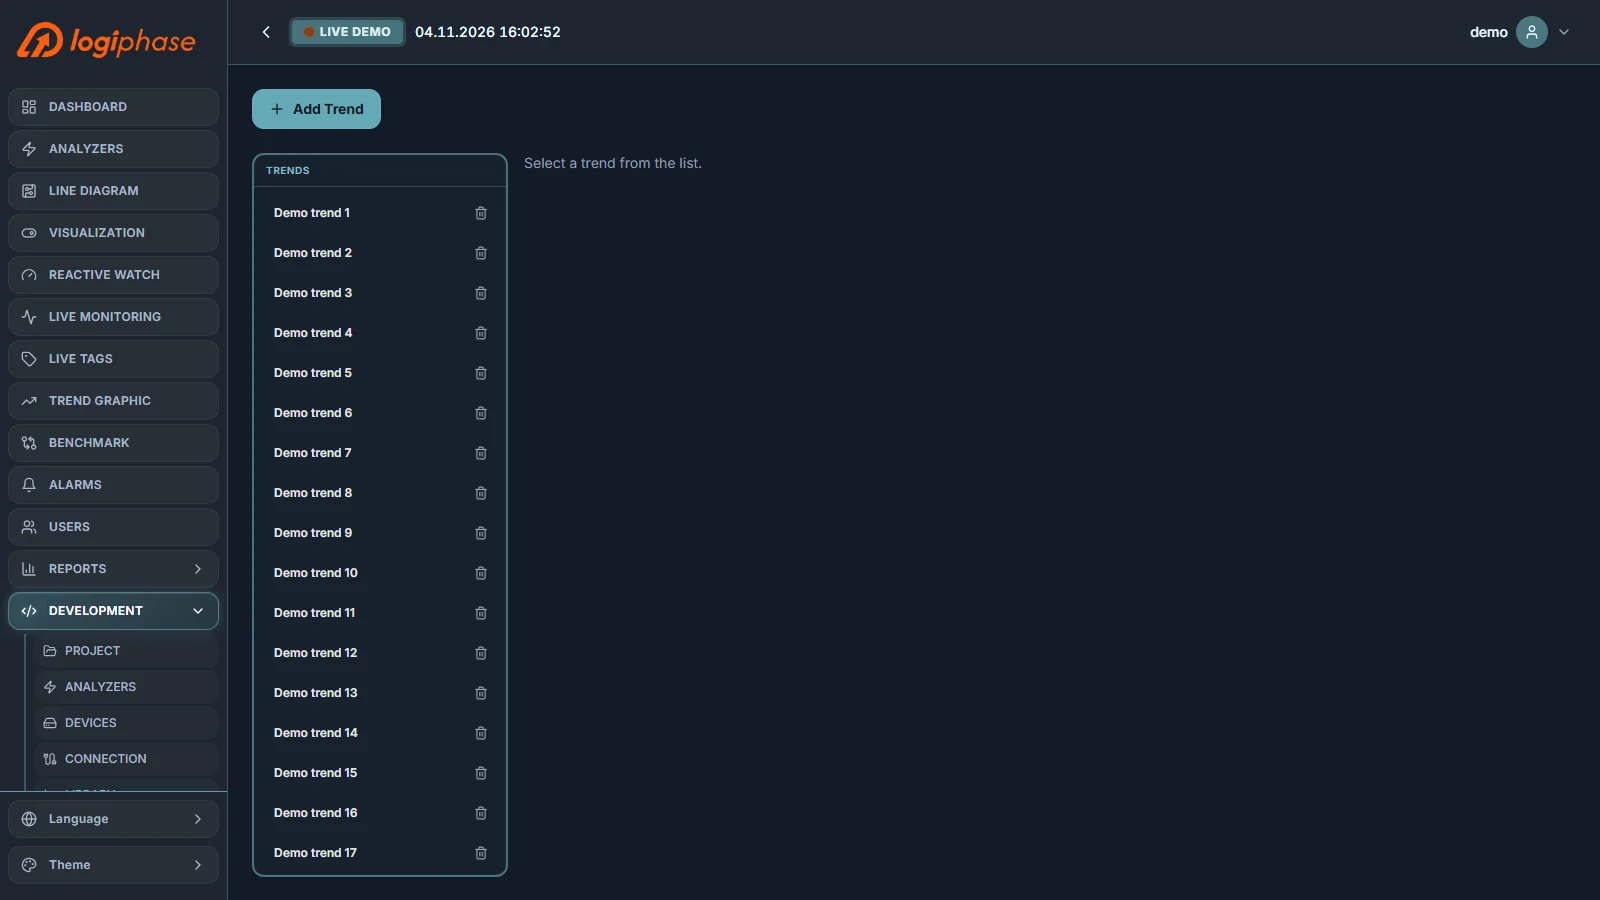
10.8 Trend Graphic
Create and name the trends shown on the Trend Graphic page and choose their tags.
10.9 SCADA
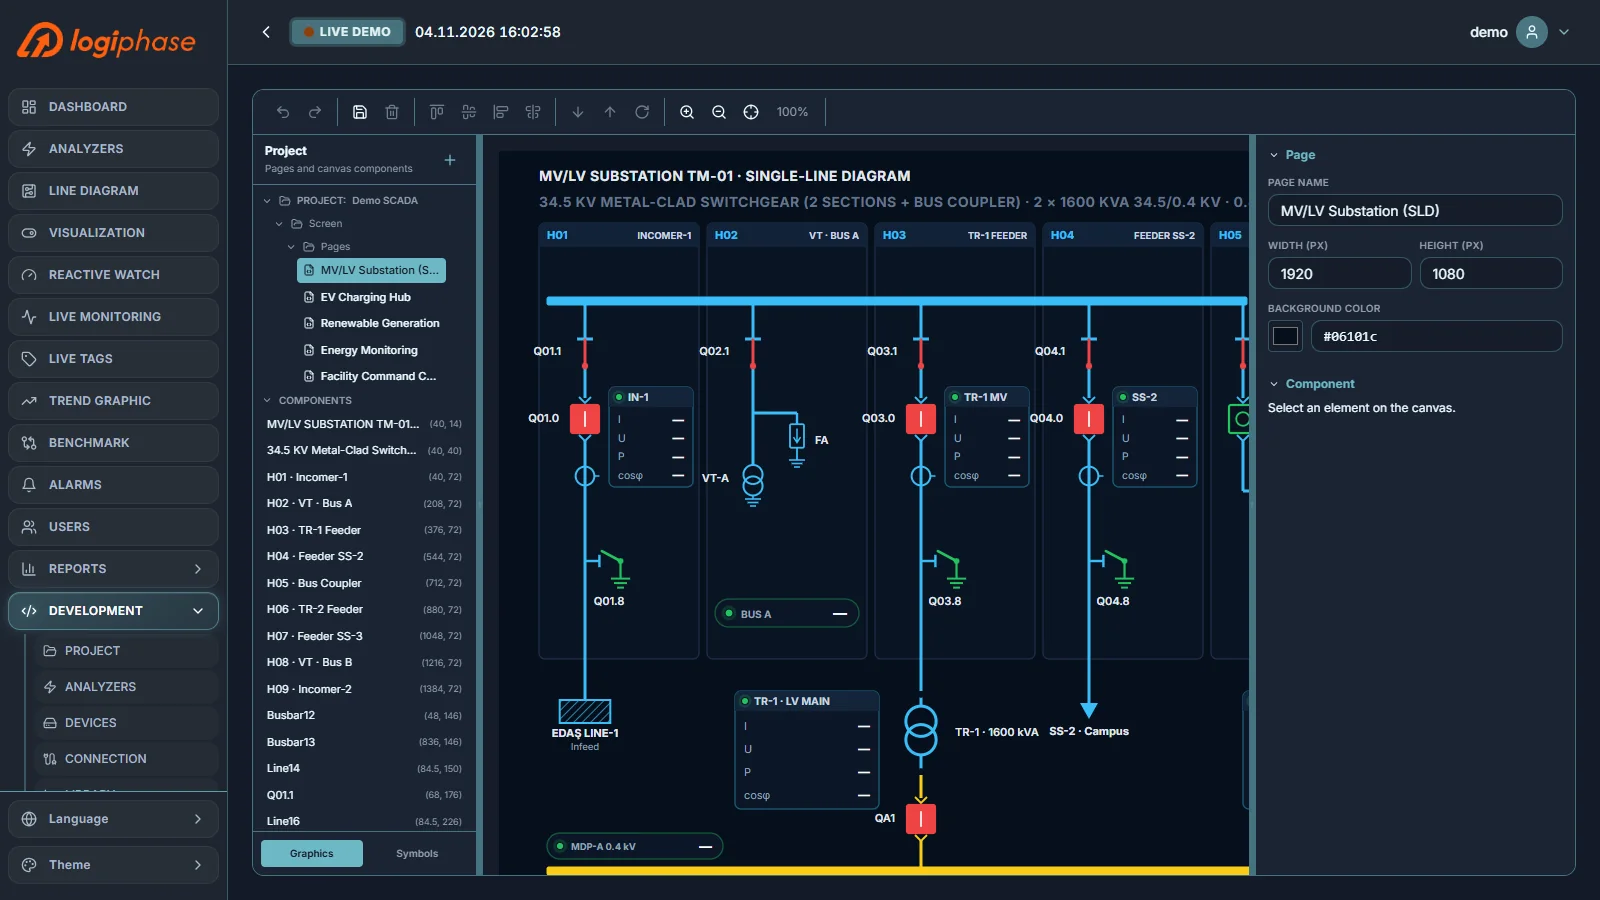
Design the Visualization screens with the drag-and-drop editor. The palette holds electrical, energy monitoring, generation, hydro, single-line diagram, EV charging, renewable and site / demand symbols; bind them to tags so they show live values and states. A project can have several pages.
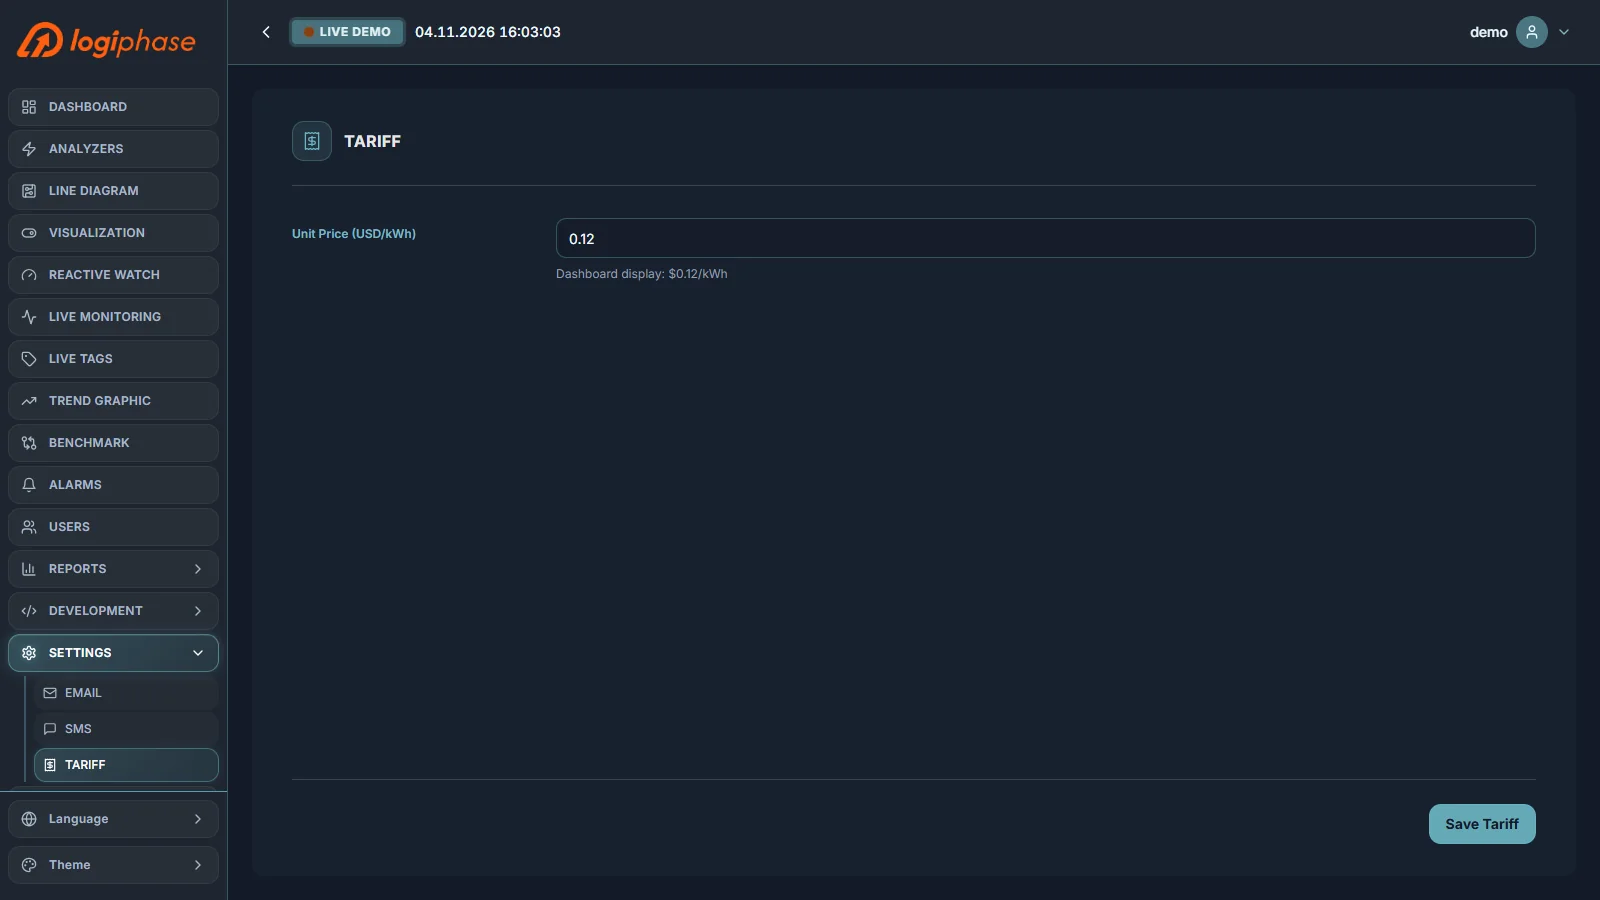
10.10 Tariff
Settings › Tariff holds the unit energy price used for the cost figures on the Dashboard and in Benchmark.