
See where every kilowatt-hour goes
We plan the metering, connect your analyzers to Logiphase EMS and set up the limits, screens and reports, so consumption, penalties and costs are visible for every site, line and feeder.
- Works with the analyzers you already have
- Reactive penalties caught before the bill arrives
- One team from metering plan to savings review
From the first meter to measurable savings
You get an energy picture your team trusts and acts on, not just another screen of numbers. These are the parts every project covers.
- 01
Energy survey & metering plan
We walk your site with maintenance and facility teams, follow the single-line diagram and decide which feeders and consumers need their own measurement.
- Single-line review
- Metering points
- Consumer groups
- 02
Analyzers & communication
Existing analyzers are connected over Modbus TCP through gateways or switches. Where a feeder has no measurement, we add an analyzer to the plan.
- Existing analyzers reused
- Gateways and switches
- Communication checks
- 03
Dashboards & single-line screens
A site dashboard, a card for every analyzer and single-line screens of your substations, chargers and renewable plants, running on live values.
- Site dashboard
- Analyzer cards
- Single-line diagrams
- 04
Reactive & demand limits
Reactive penalty limits and contracted demand are set for each analyzer, with early warnings and alarms before a limit is crossed.
- Reactive penalty limits
- Contracted demand
- Alarm rules
- 05
Cost & carbon reporting
Your unit prices and emission factors are entered, so consumption is shown as money and CO₂, and consumers can be ranked against each other.
- Energy cost
- CO₂ and equivalents
- Benchmark and CSV export
- 06
Training & savings review
Energy managers and maintenance teams are trained on their own site. We review the first weeks of data with you and point out where the savings are.
- Training by role
- First-data review
- Rollout to more sites
- Active power
- Reactive power
- Apparent power
- Energy
- Voltage & current
- Phase balance
- Reactive ratio
- Contracted demand
- Top consumers
- Energy cost
- CO₂ emissions
- Communication status
Five phases from first meter to savings
Every project follows the same path. You approve each phase before the next one starts, and you always know what comes next.
We map how energy flows on your site
A site visit with maintenance and facility teams. We go through the single-line diagram, the existing analyzers and recent energy bills, and find where measurement is missing.
- Existing analyzer list
- Bill and tariff review
- Measurement gaps
Screens your energy team will use every day
Recorded from the Logiphase EMS live demo. Hover a screen to see it run, or open the demo and try it yourself.
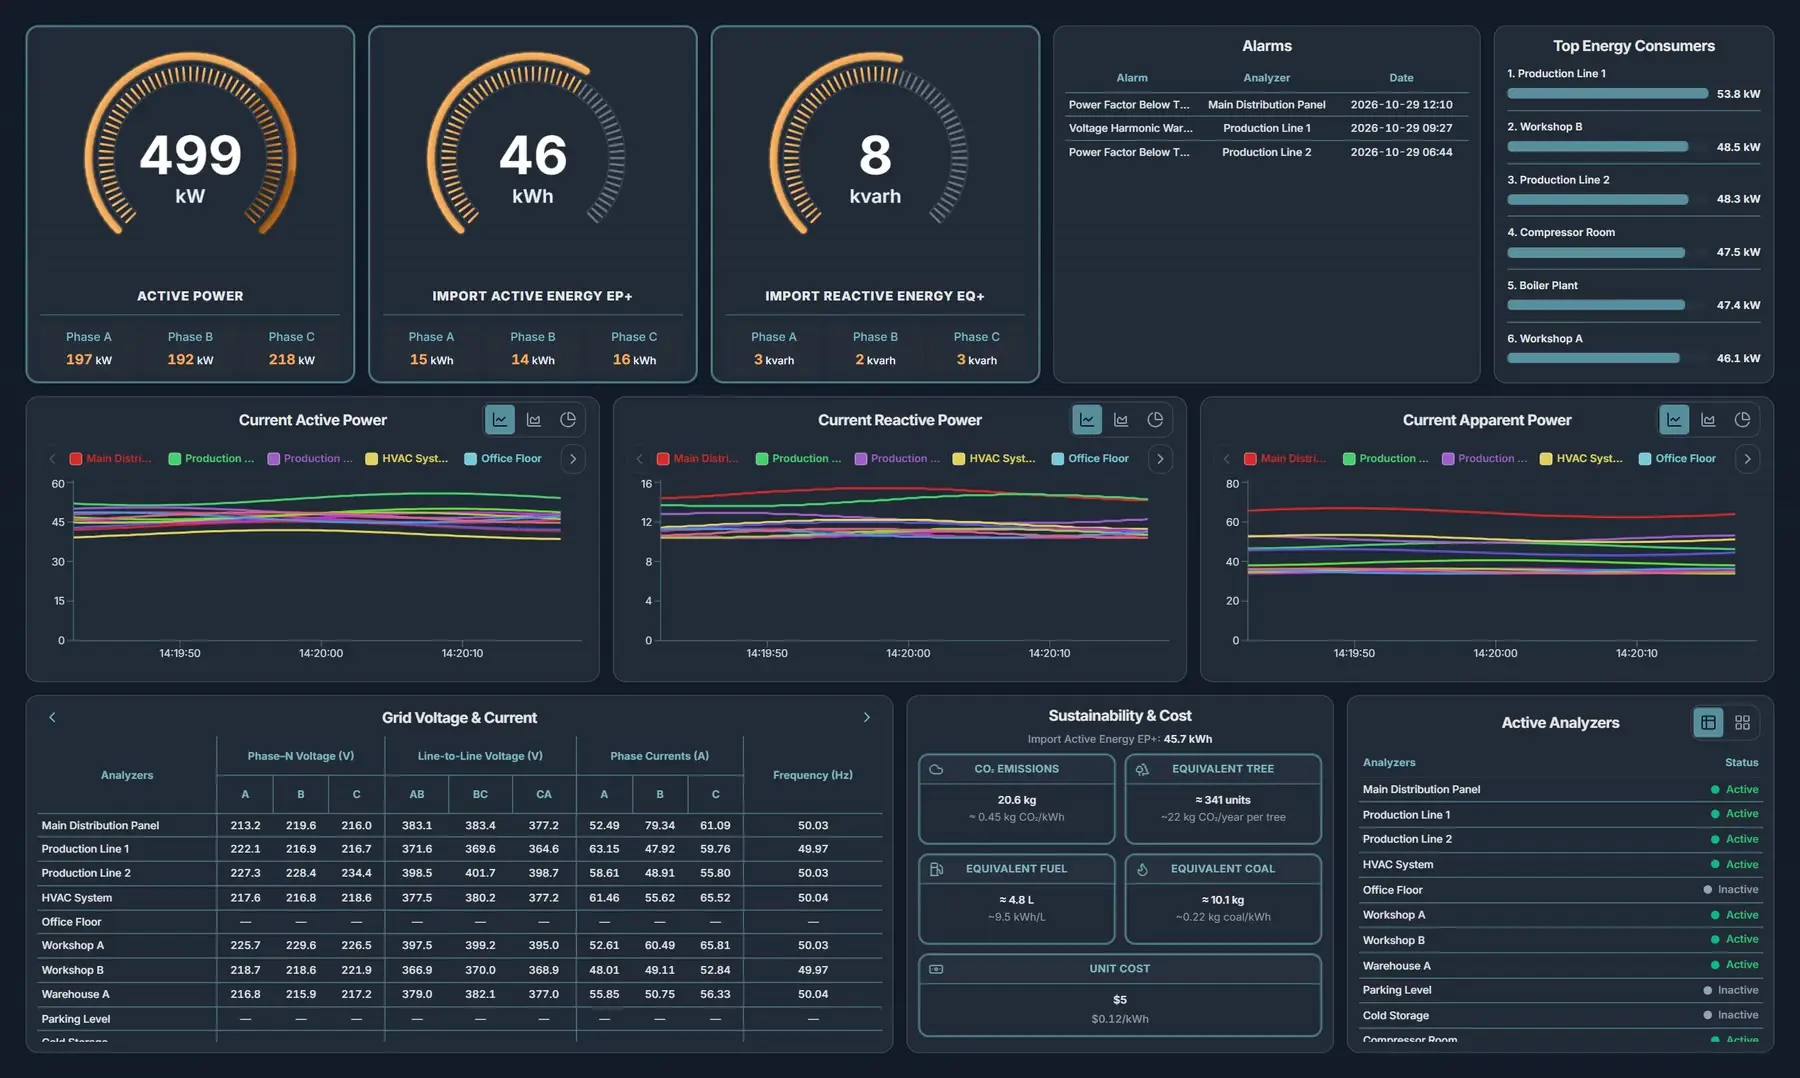
Site dashboard
Live demo- Active · reactive power
- Top consumers
- Voltage & current
- Alarms
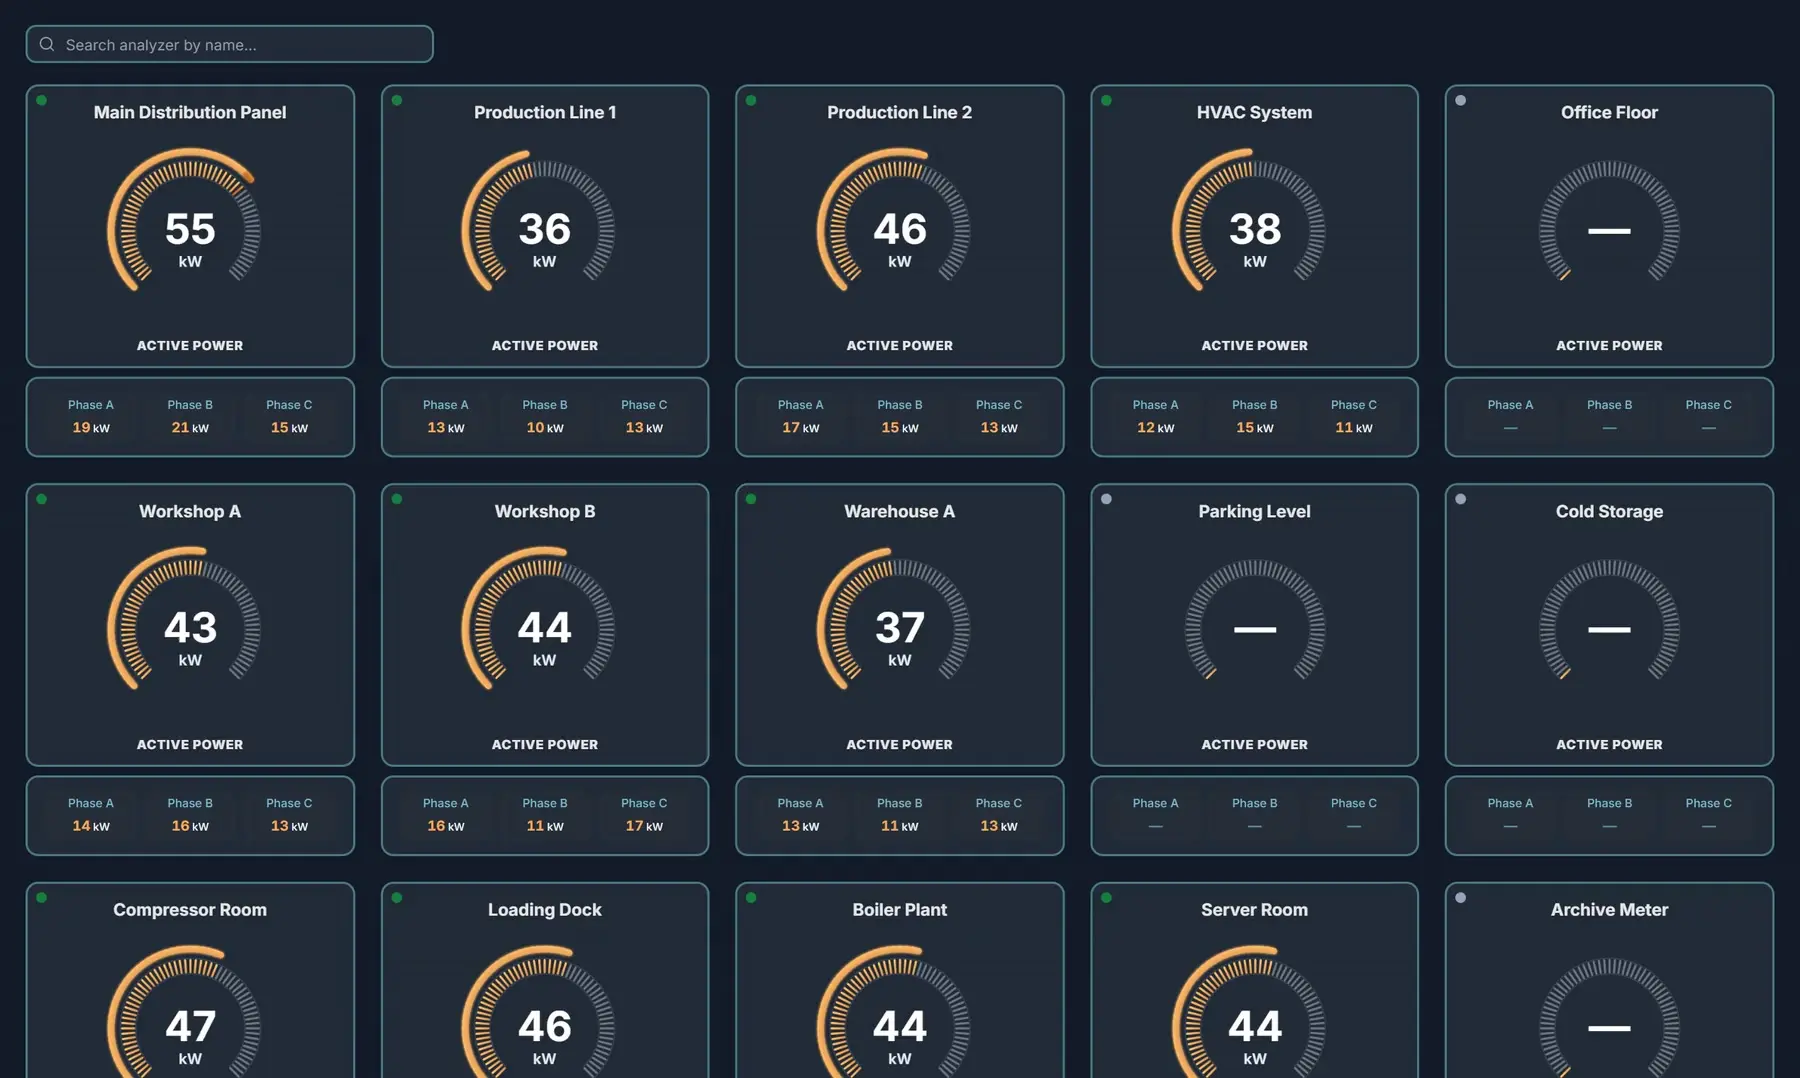
Analyzer cards
Live demo- Live per analyzer
- Phase A · B · C
- Online / offline
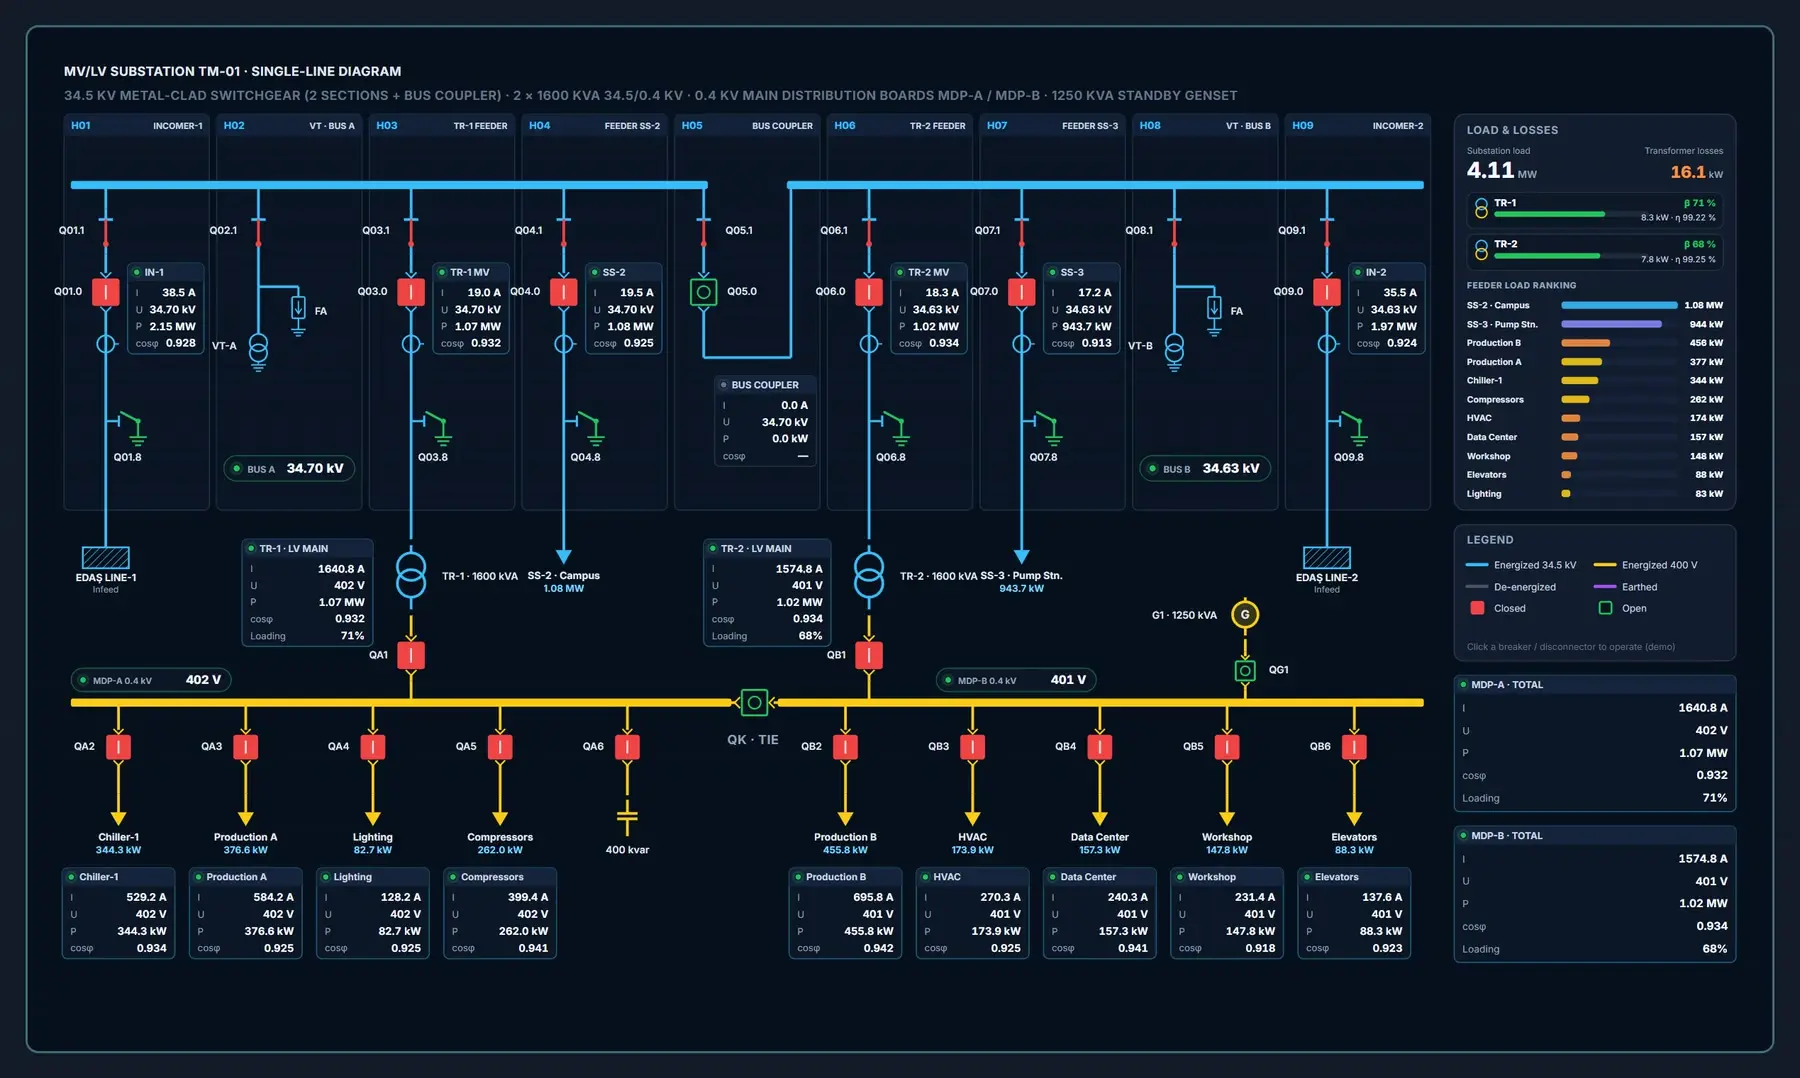
Single-line & plant screens
Live demo- Single-line diagram
- EV charging
- Solar · wind · battery
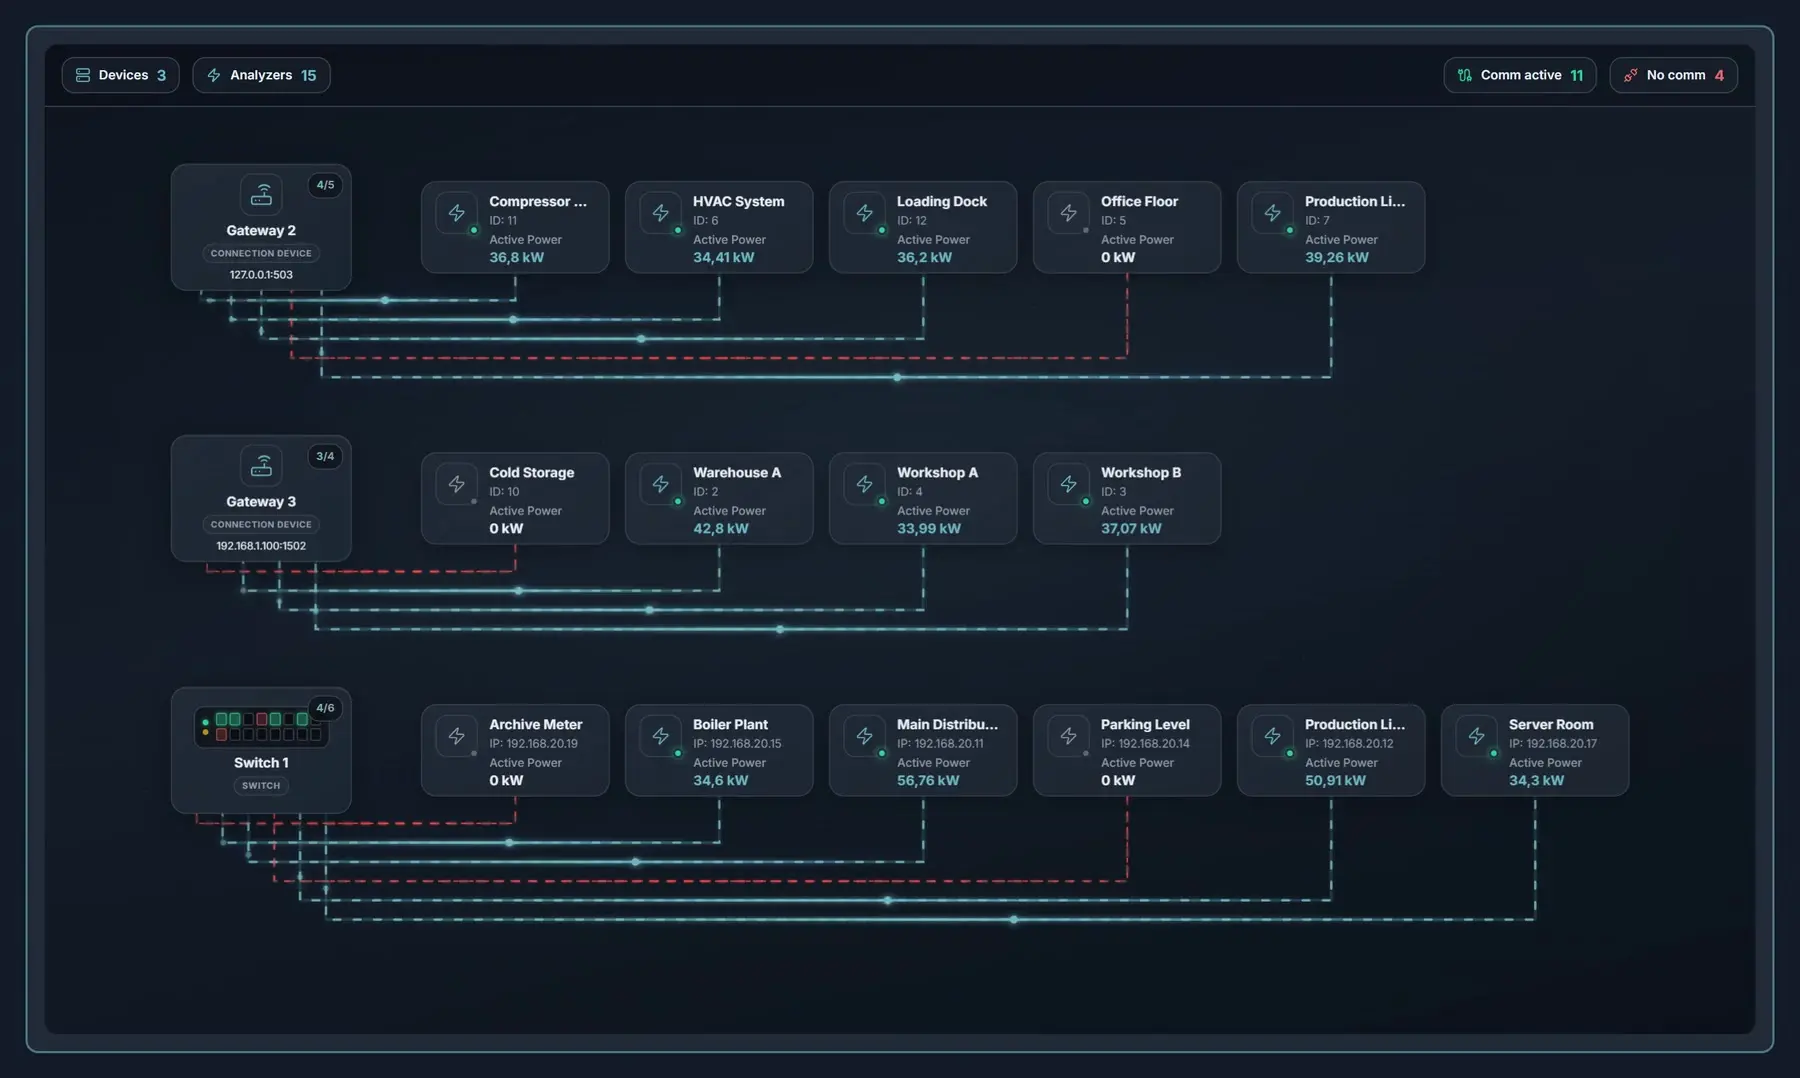
Communication line
Live demo- Gateways & switches
- Link status
- Modbus TCP
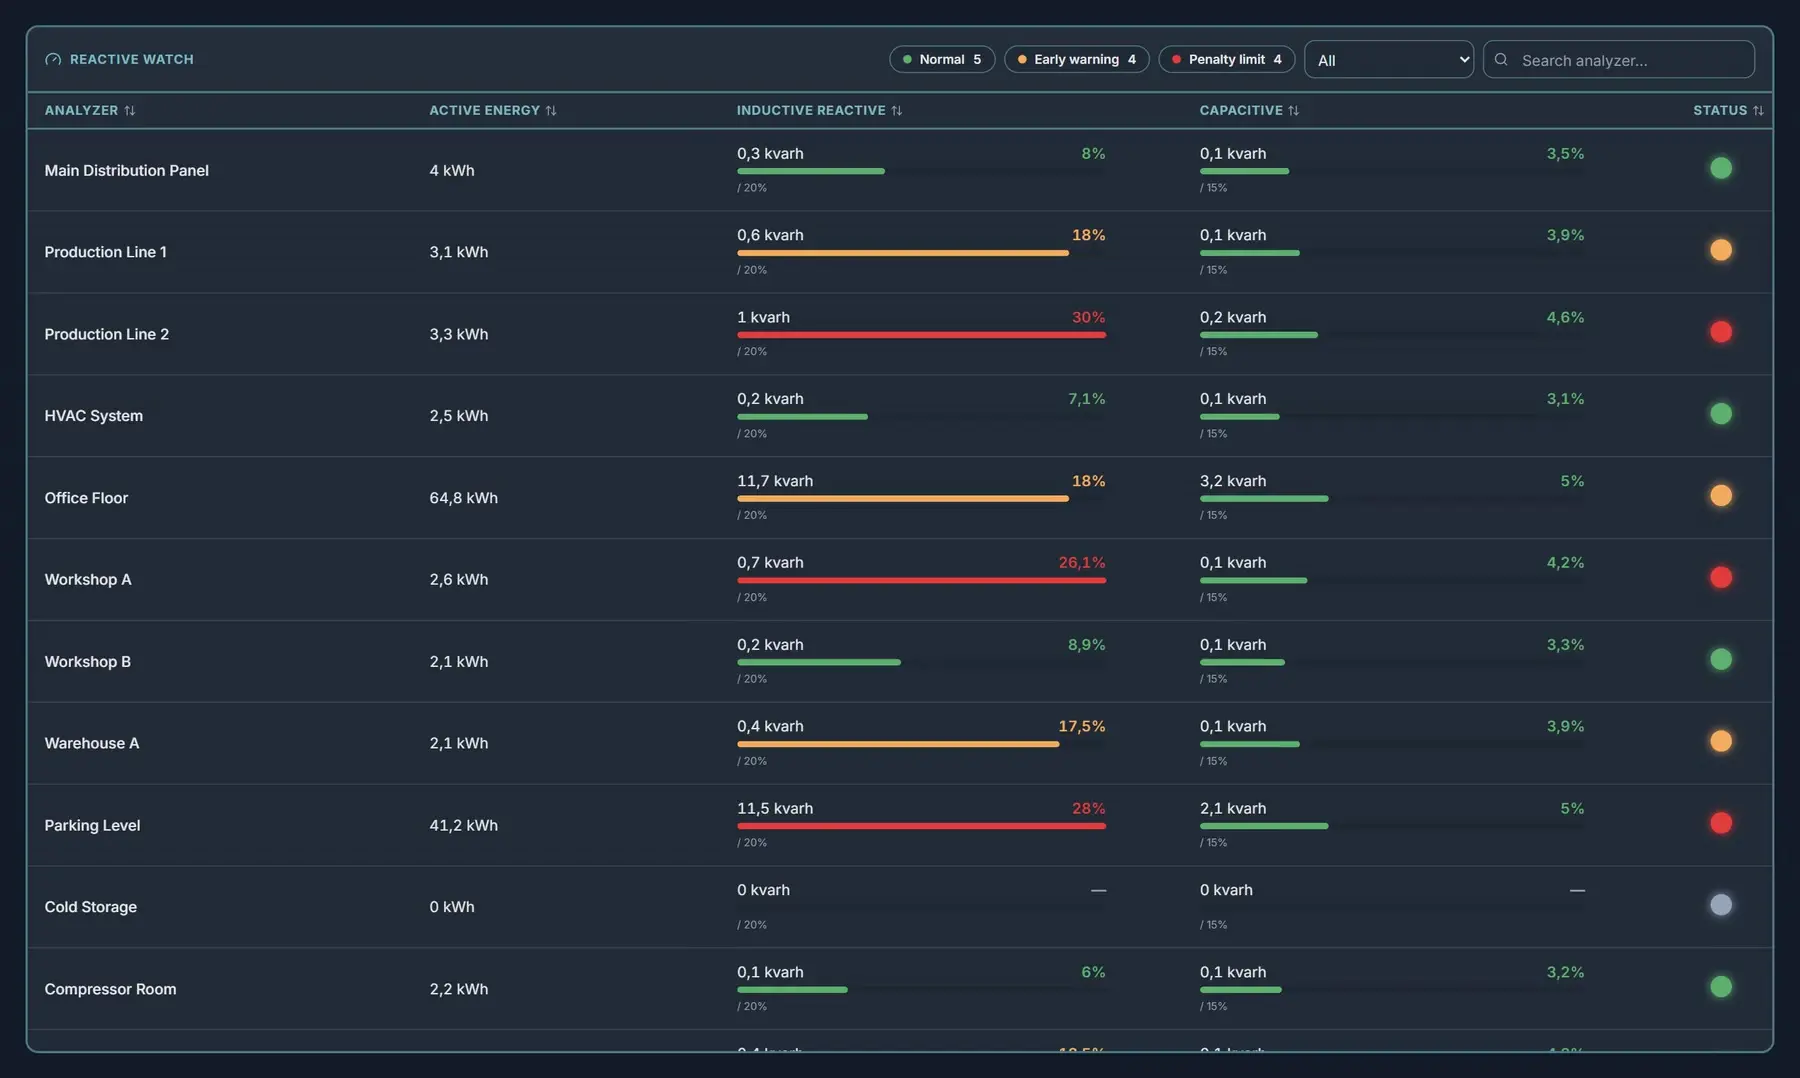
Reactive watch
Live demo- Inductive · capacitive
- Early warning
- Penalty limit
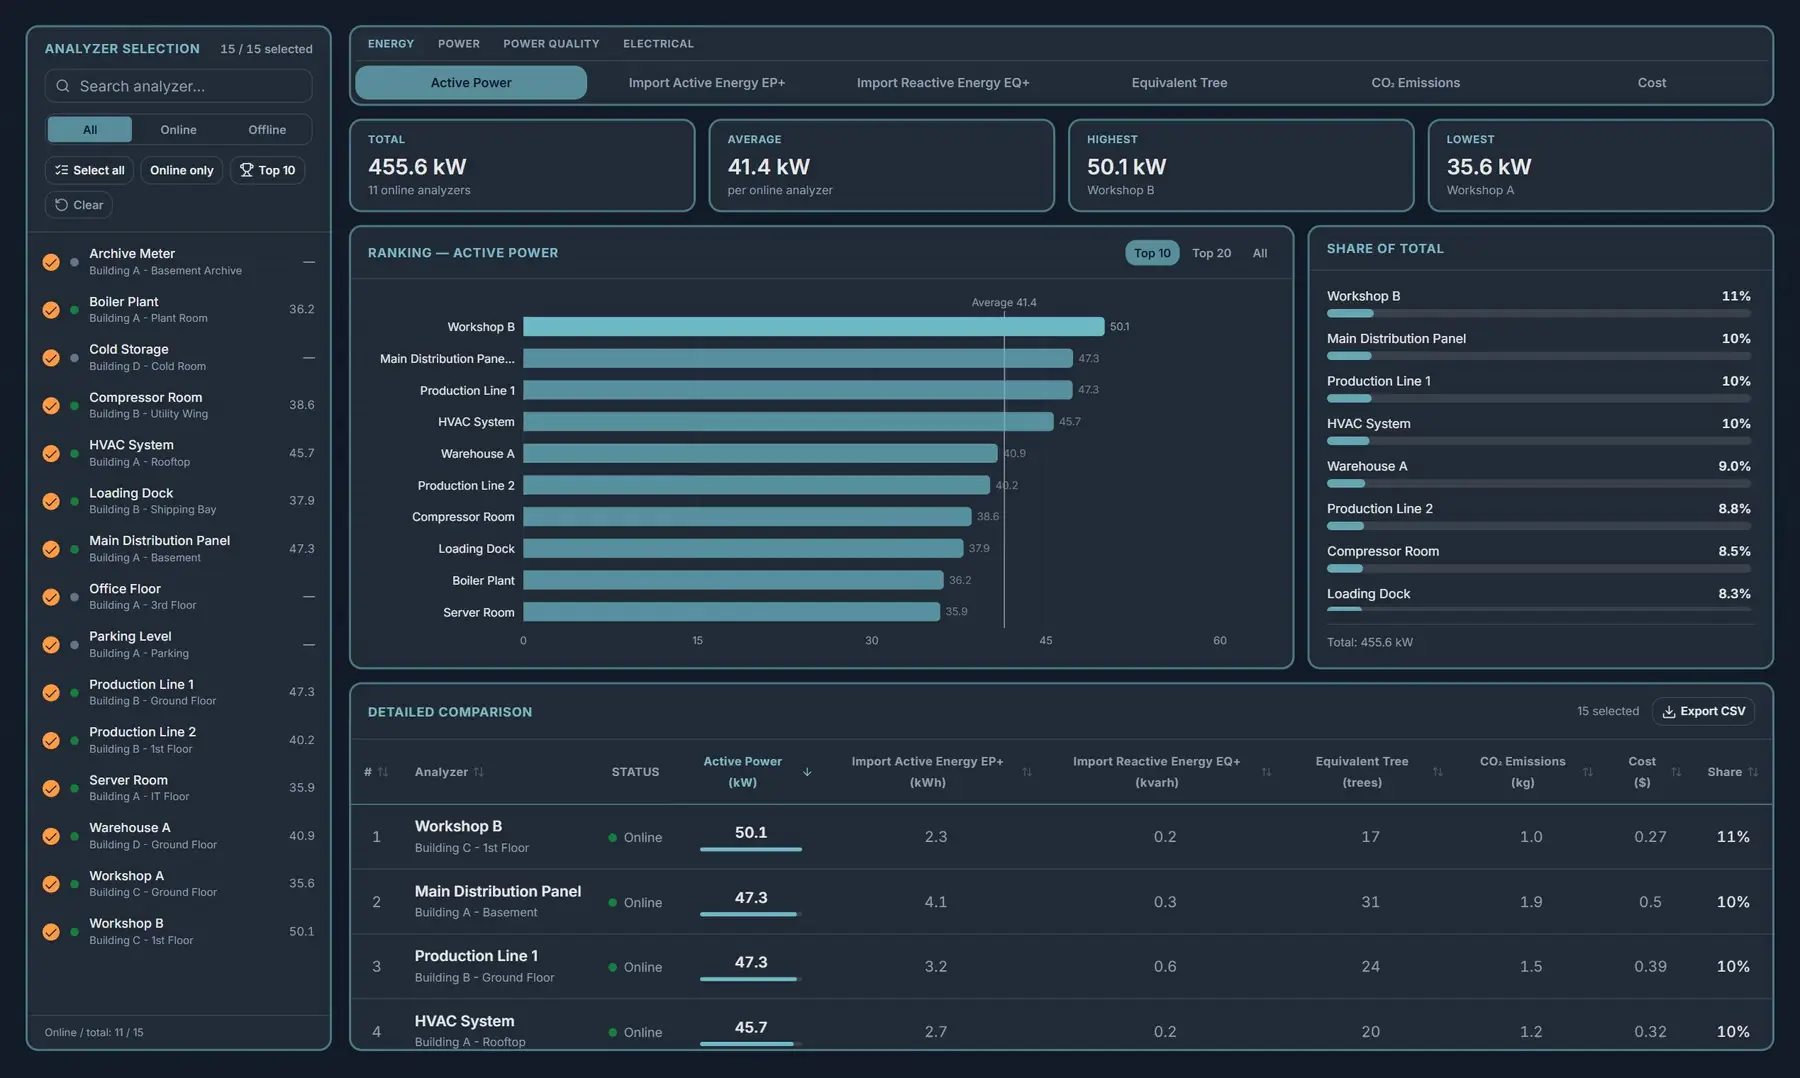
Benchmark
Live demo- Energy · power · quality
- Ranking & share
- CSV export
Energy monitoring from the people who build it
Logiphase EMS is developed by GreenSoft. The engineers who plan your metering work next to the people who write the code, so your site shapes the product.
- 01
We build the software we deliver
When your site needs something Logiphase does not do yet, it goes into the product itself instead of a spreadsheet next to it.
- 02
Penalties caught before the bill
Reactive ratios and demand are watched against their limits all month, with early warnings, so compensation and peaks are fixed before the period closes.
- 03
Energy in money and carbon
Consumption is shown as cost and CO₂ next to the kilowatt-hours, so savings can be reported to management and sustainability teams in their own terms.
- 04
Start with the main feeders, grow from there
Begin with the incomers and the biggest consumers, prove the savings, then add feeders, buildings and sites to the same system.
Questions before a project
Usually not for the main feeders. Analyzers already in your panels are connected over Modbus TCP, through a gateway or on an Ethernet switch. Where an important consumer has no measurement, we add an analyzer to the metering plan.
Tell us about your sites
Share how many sites you run and what you measure today. An engineer will get back to you with questions and a first proposal.
- Number of sites and main feeders
- Analyzer models already installed
- Single-line diagram
- A few recent energy bills