



2. DASHBOARD
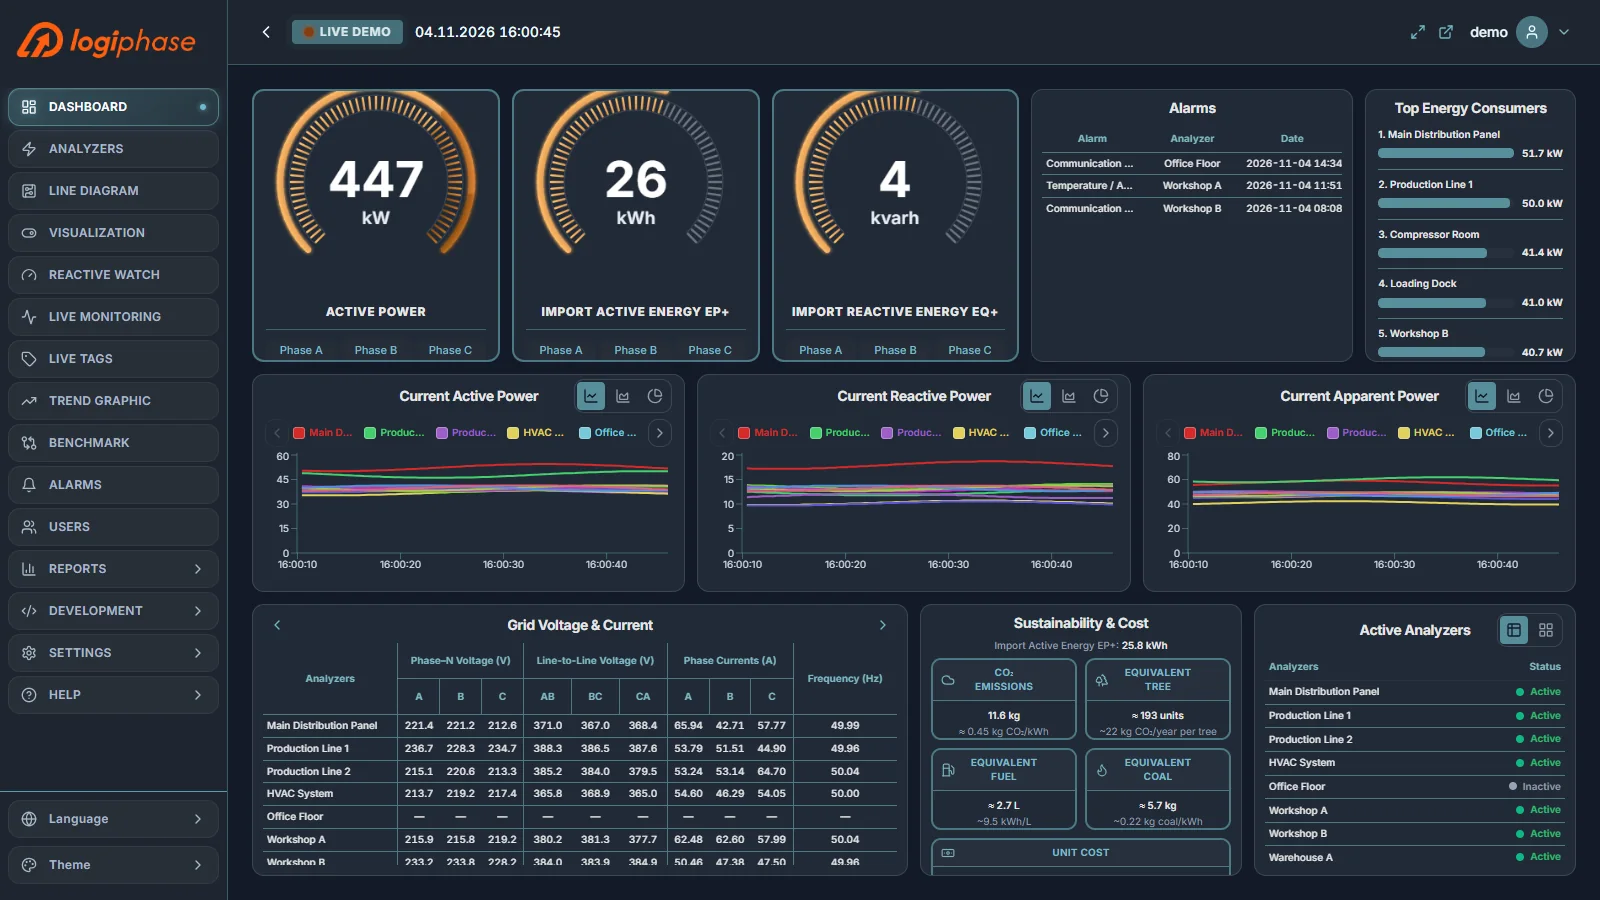
The Dashboard is the home page of Logiphase. It brings the key figures and charts of the whole facility into one layout designed for control-room displays.
2.1 Gauges
The top row shows three gauges: Active Power (kW), Total Import Active Energy EP+ (kWh) and Total Import Reactive Energy EQ+ (kvarh), each with its phase A, B and C breakdown.
2.2 Power Charts
Three charts follow the active (kW), reactive (kvar) and apparent (kVA) power of every analyzer over time. Each chart can be shown as a line, area or pie; the legend shows, hides or isolates analyzers.
2.3 Alarms and Top Consumers
The Alarms card lists the latest alarms; View All opens the Alarms page. Top Energy Consumers ranks the analyzers by active power, so the largest loads are visible at a glance.
2.4 Grid Measurements
The grid table lists every analyzer with phase and line voltages, phase currents and frequency, and cycles through power factor / cos φ and THD values. Offline analyzers show a dash instead of a value.
2.5 Sustainability and Cost
The Sustainability & Cost card turns the imported active energy into its CO₂ emissions, equivalent tree planting, fuel and coal equivalents and energy cost. The figures are indicators based on the configured unit price and conversion factors, not billing values.
2.6 Active Analyzers
Active Analyzers shows how many analyzers are online and offline, as a table or a pie chart.