



4. LIVE MONITORING
4.1 Live Monitoring
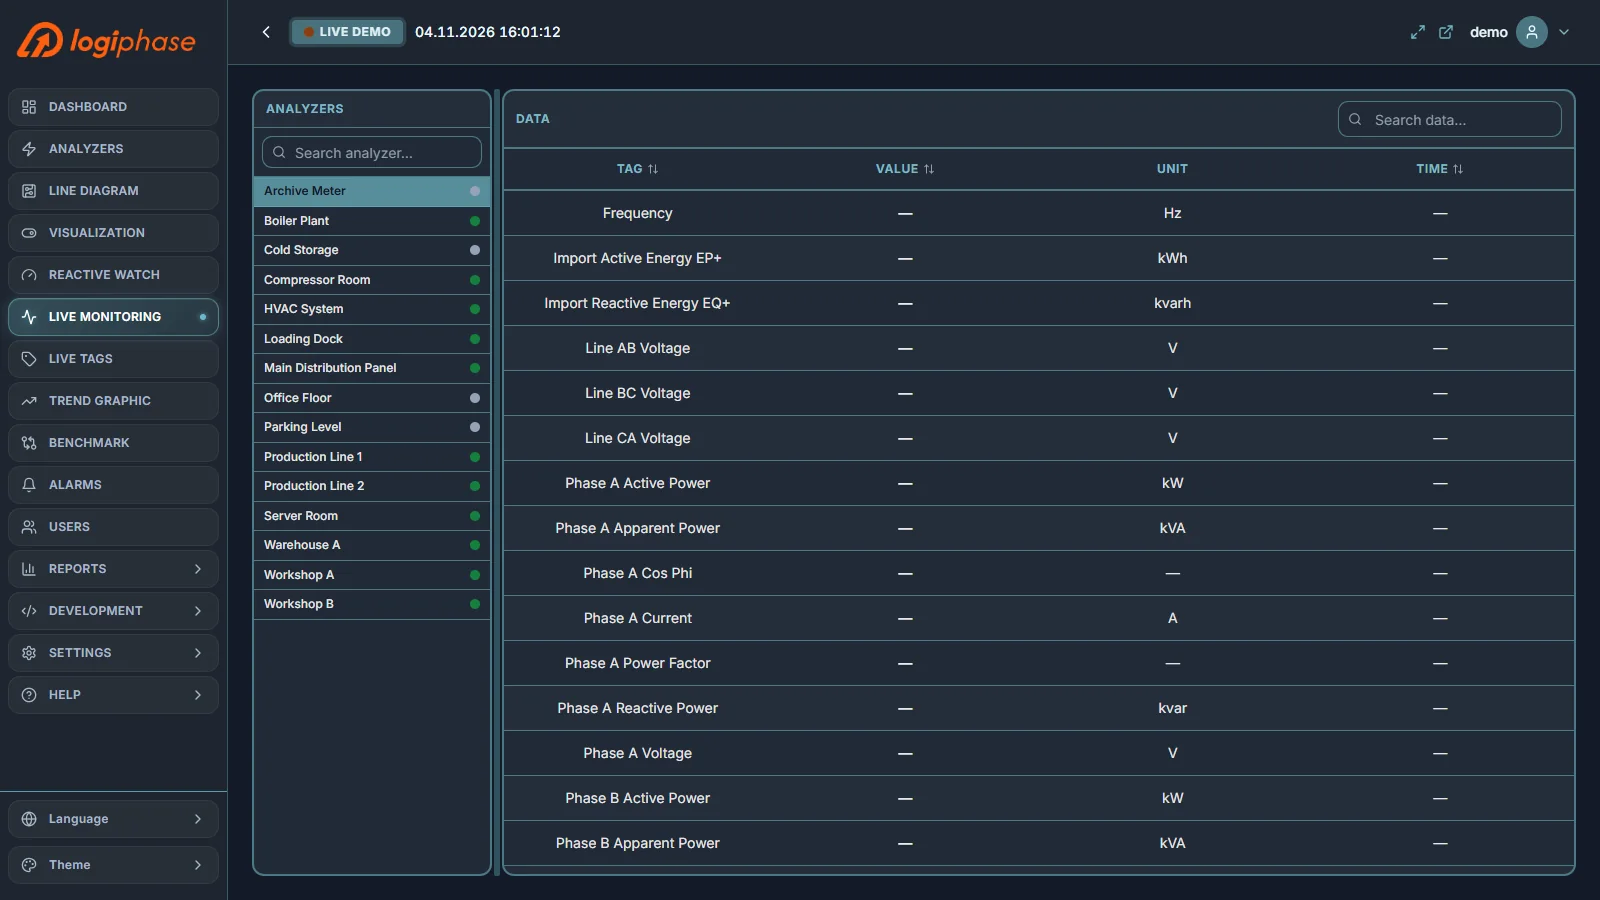
Live Monitoring has two panes: the analyzers on the left and all measurement values of the selected analyzer on the right, with their name, value, unit and time.
4.2 Live Tags
Live Tags follows the project structure: devices, their frames and the tags of each frame, with the latest value, unit and time. Use the search boxes above each column to filter, and drag the splitters to resize the panes.
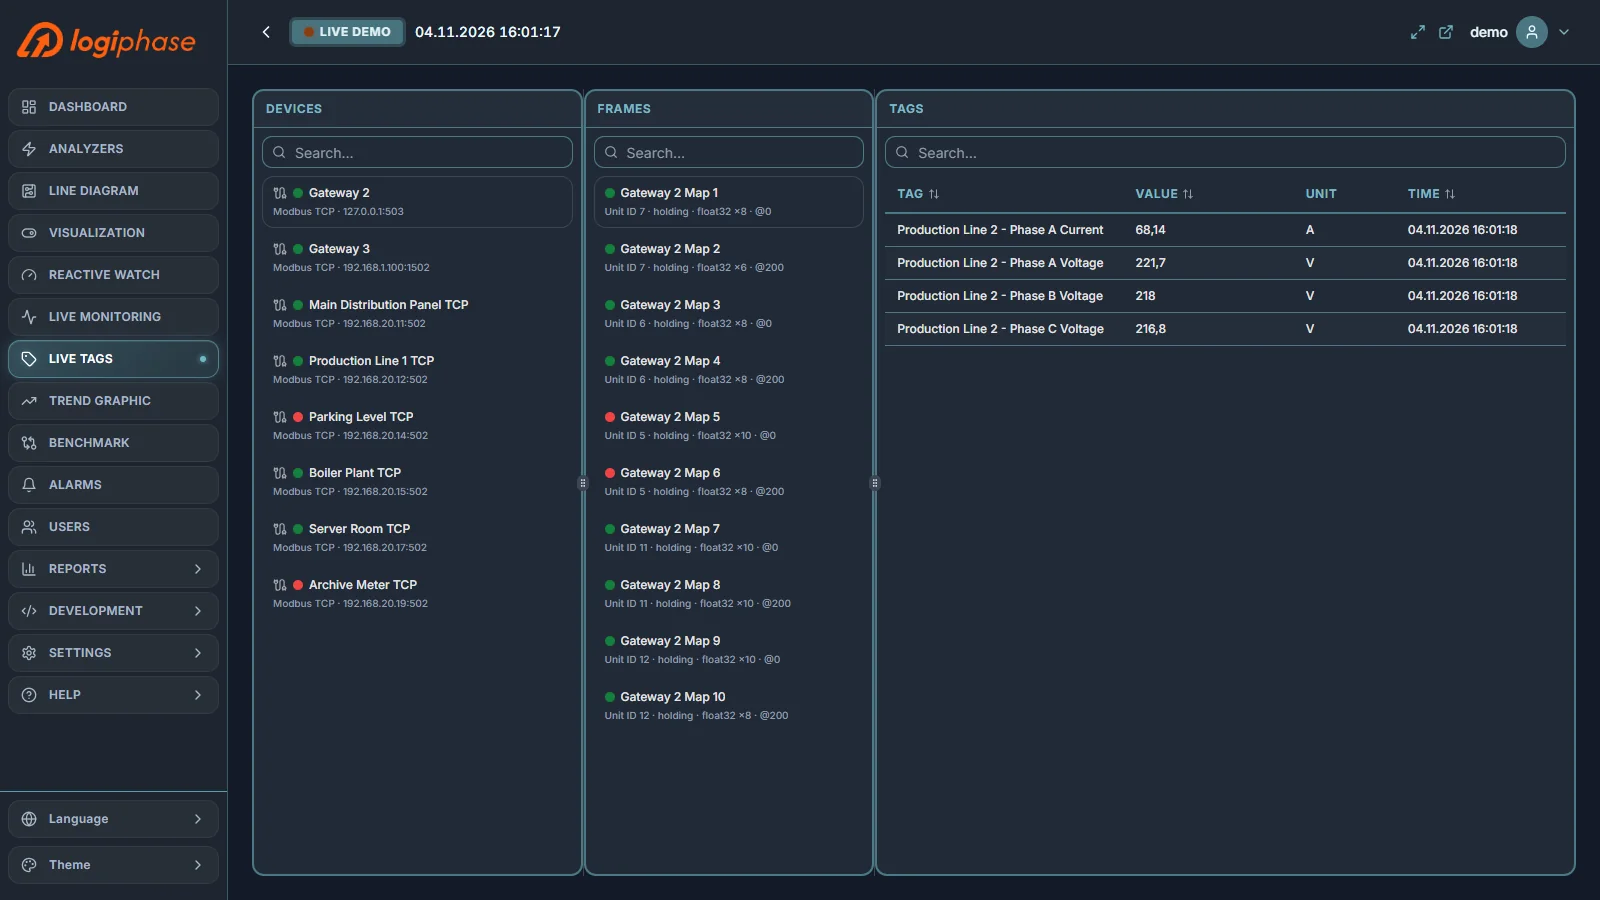
A green indicator shows a connected device; grey means disconnected or offline.