



5. LINE DIAGRAM AND VISUALIZATION
5.1 Line Diagram
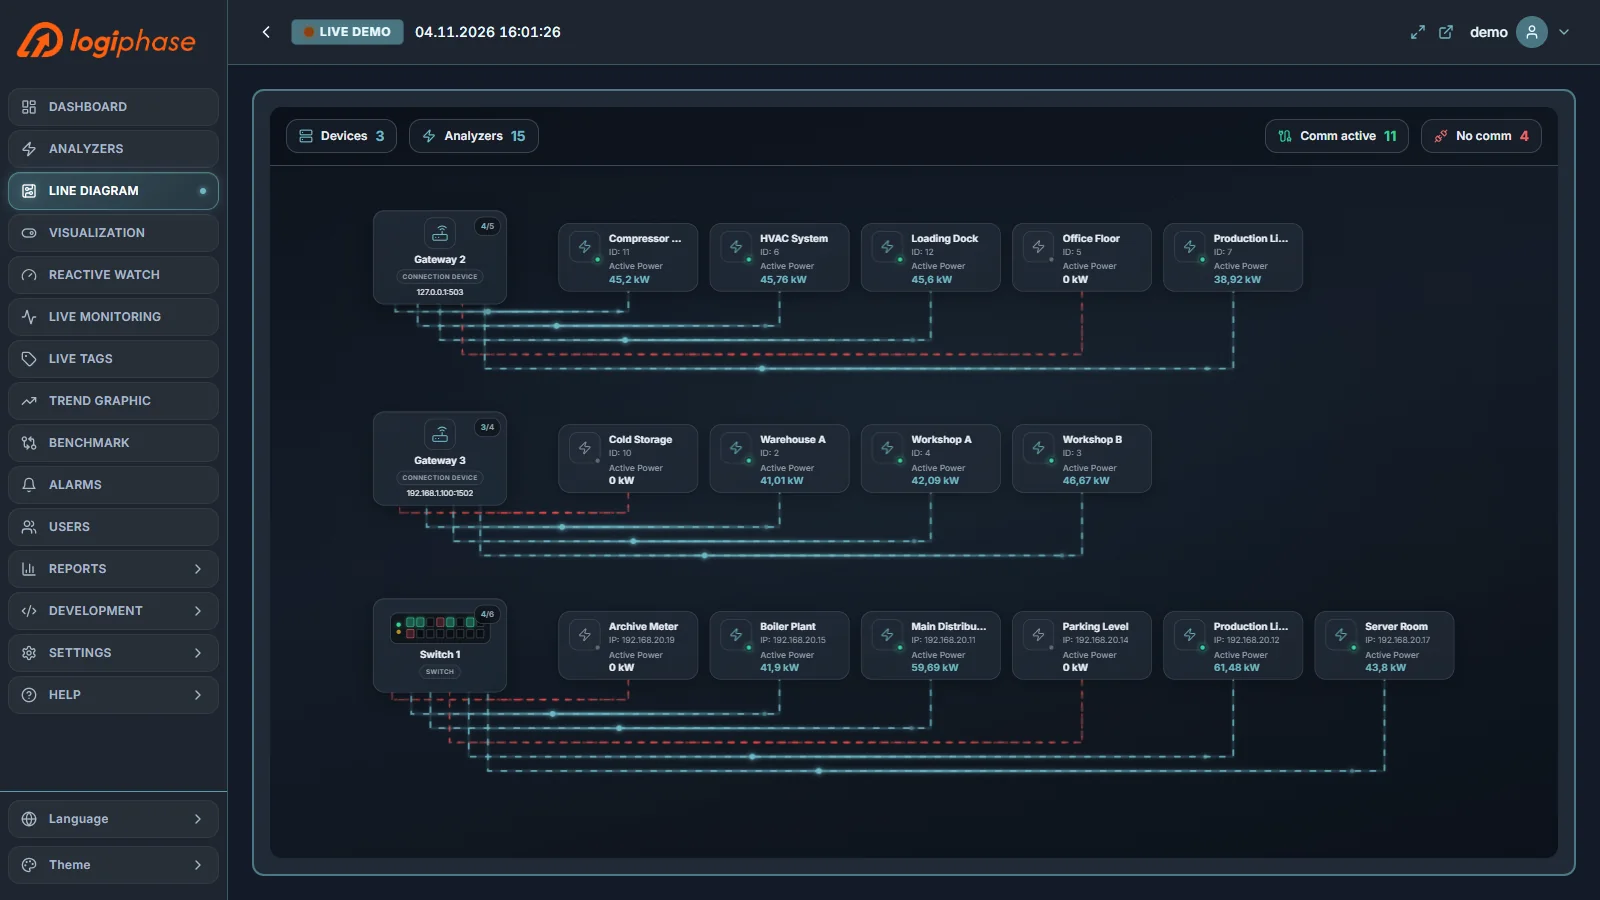
The Line Diagram draws the communication topology of the project: each gateway or switch with the analyzers connected to it. Healthy links show data flowing; a link that stops communicating stands out immediately, so you can see which device or connection to check.
5.2 Visualization
Visualization shows the SCADA screens of the project, such as single-line diagrams of substations and distribution boards, with live values from the analyzers. Breakers, transformers and busbars are coloured by their state, and energy-specific widgets such as phasor diagrams, power triangles and harmonic spectra show power quality at a glance.
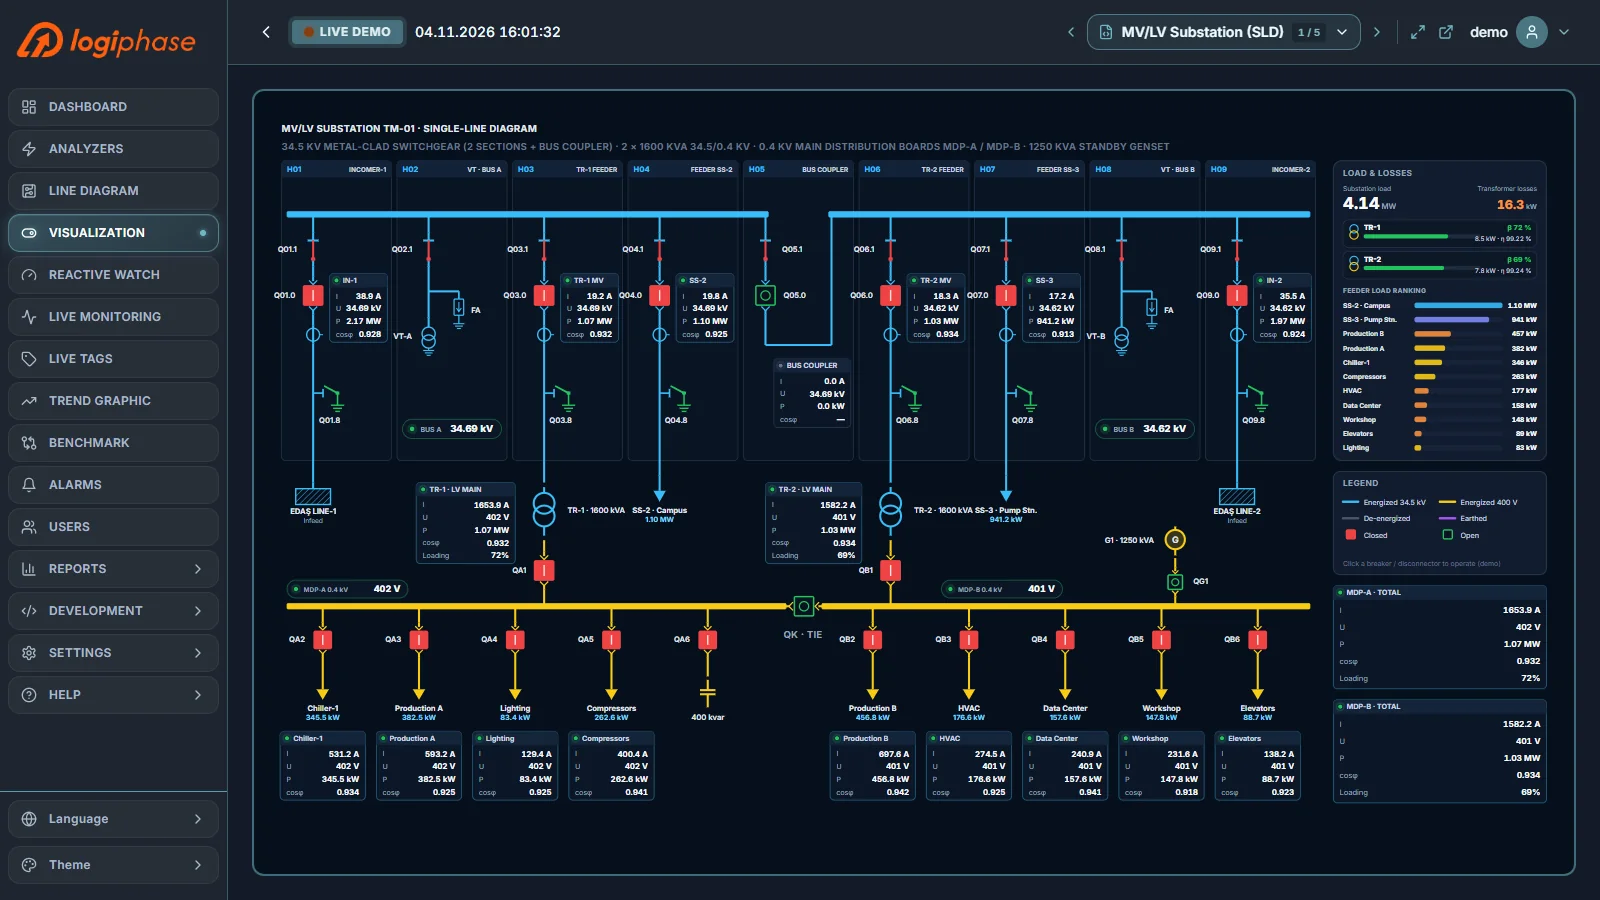
Screens can be opened full screen or in a separate window. They are designed in Development › SCADA (see Configuration).