
Turn lost production time into output
We connect your machines to Proveris OEE, set up shifts, products and stop reasons with your team, and stay with you until the numbers turn into daily improvements on the shop floor.
- Works with the machines and sensors you already have
- Operators record stop reasons at the machine
- One team from assessment to improvement
From the first measurement to lasting gains
You get OEE figures your team trusts and uses every day, not just software on a screen. These are the parts every project covers.
- 01
Line assessment
We walk your lines with production and maintenance, see how they run today and agree on what counts as planned time, ideal speed and good output.
- Machine and line inventory
- Baseline OEE
- Agreed loss definitions
- 02
Machine connection
Run and stop states, part counts and rejects are read from the controllers and sensors already on your machines. Where a machine has no usable signal, we add one.
- Run / stop signals
- Part and reject counters
- Existing sensors reused
- 03
Shifts, products & targets
Shift plans, products, ideal cycle times and work orders are set up, so every figure is measured against the right target.
- Shift calendar
- Products and cycle times
- Work orders and targets
- 04
Downtime reasons
A stop reason list written with your team, so every stop is classified as planned or unplanned and nothing stays unexplained.
- Reason list per line
- Planned · unplanned
- Approval flow
- 05
Dashboards, kiosks & reports
A factory dashboard for management, kiosk screens for operators and reports by machine and period for the weekly review.
- Factory dashboard
- Operator kiosk
- PDF, CSV and Excel reports
- 06
Training & improvement
Operators, shift leaders and managers are trained on their own lines. We review the first results with you and pick the losses worth fixing first.
- Training by role
- First-results review
- Rollout to more lines
- OEE
- Availability
- Performance
- Quality
- Downtime
- Stop reasons
- MTBF
- MTTR
- Production
- Defects & wastage
- Shift target vs actual
- Energy
Five phases from first data to daily use
Every project follows the same path. You approve each phase before the next one starts, and you always know what comes next.
We see how your lines run today
A visit to the shop floor with production, maintenance and quality. We list the machines, look at how stops and output are tracked today and agree on the losses to measure.
- Machine and line list
- Baseline OEE estimate
- Agreed loss definitions
Screens your team will use every day
Recorded from the Proveris OEE live demo. Hover a screen to see it run, or open the demo and try it yourself.
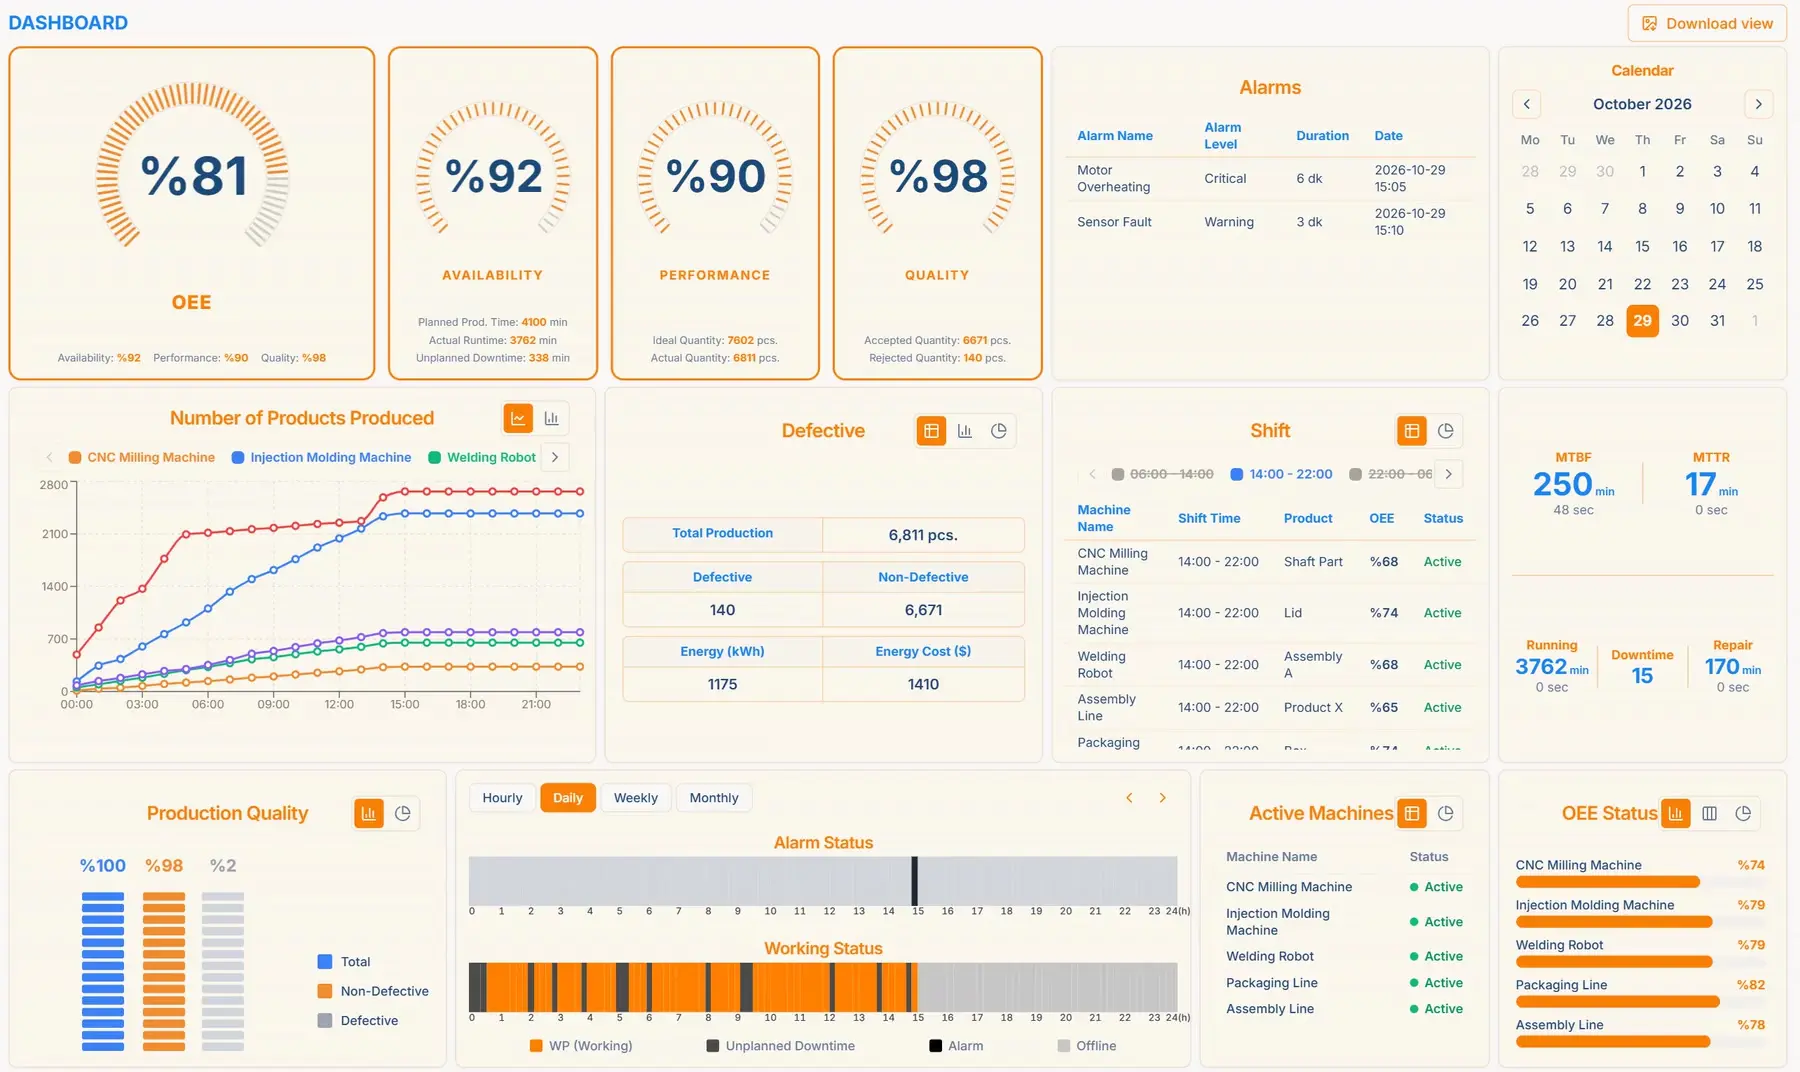
Factory dashboard
Live demo- OEE · A · P · Q
- Production & defects
- Energy
- MTBF · MTTR
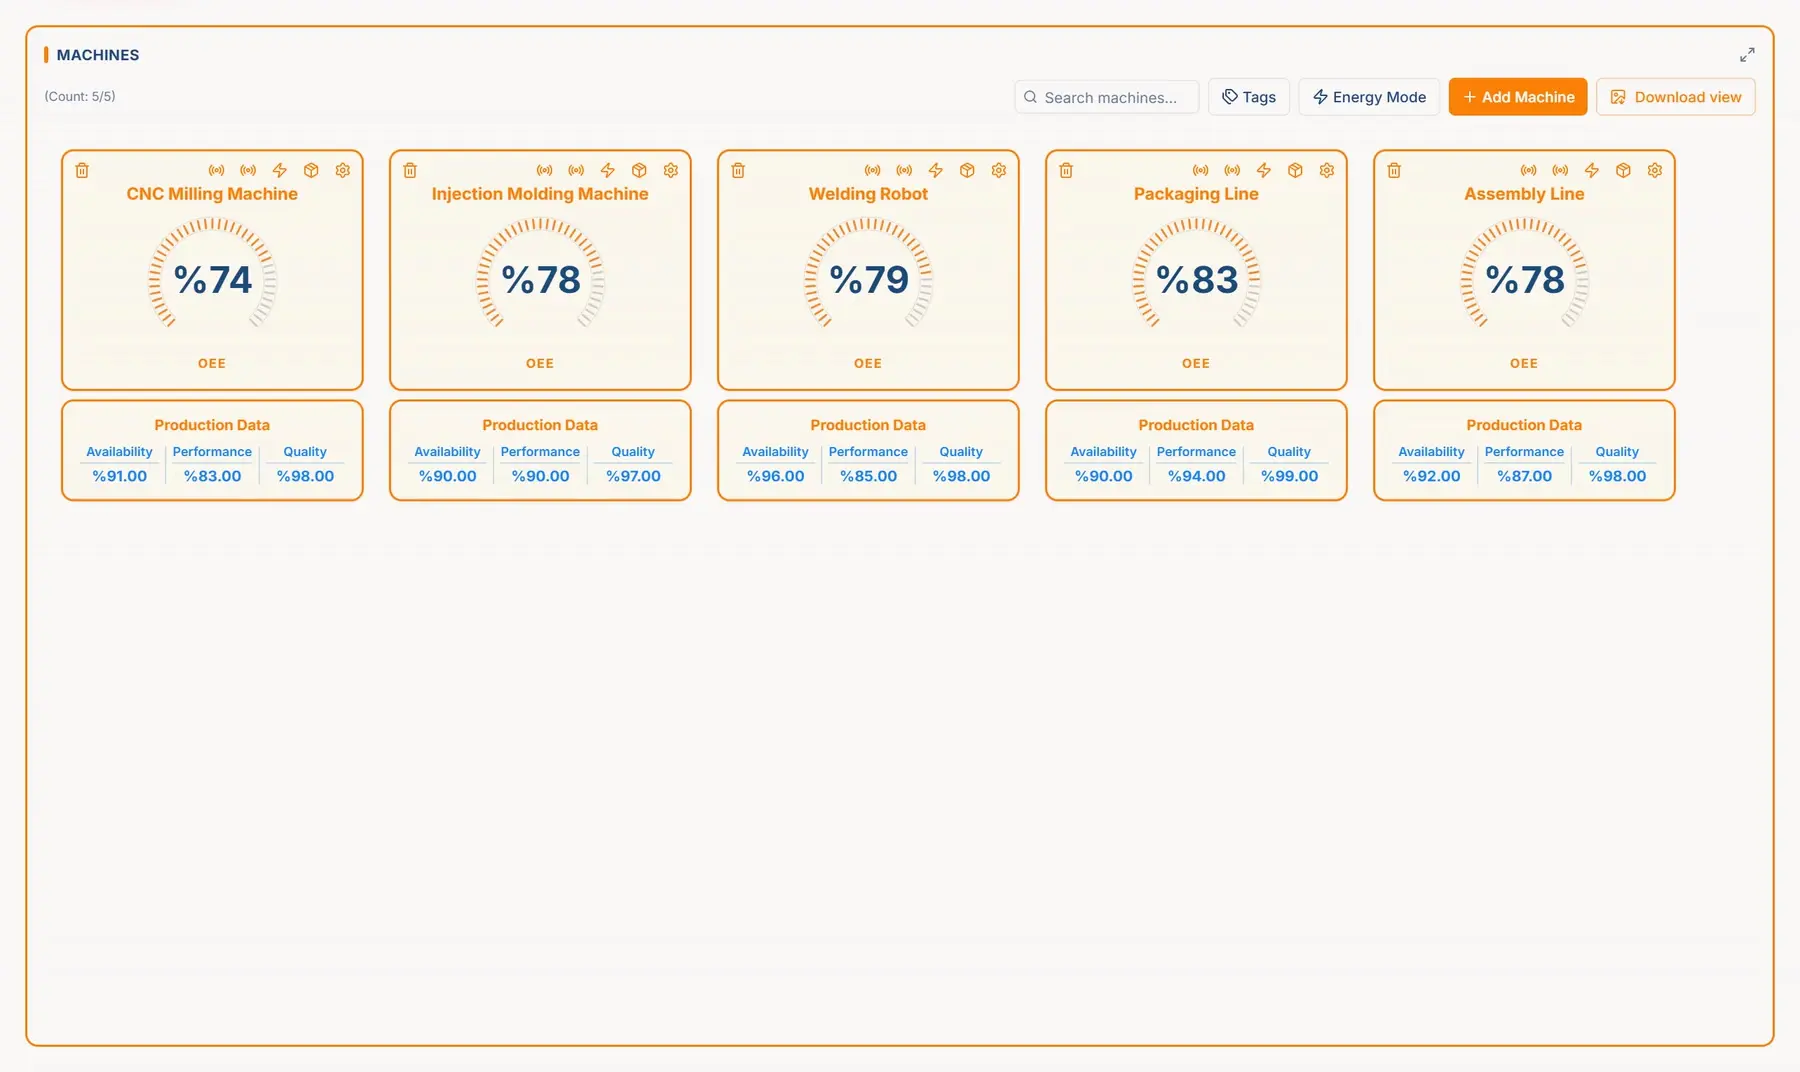
Machine detail
Live demo- Machine cards
- Status timeline
- Shift results
- Products made
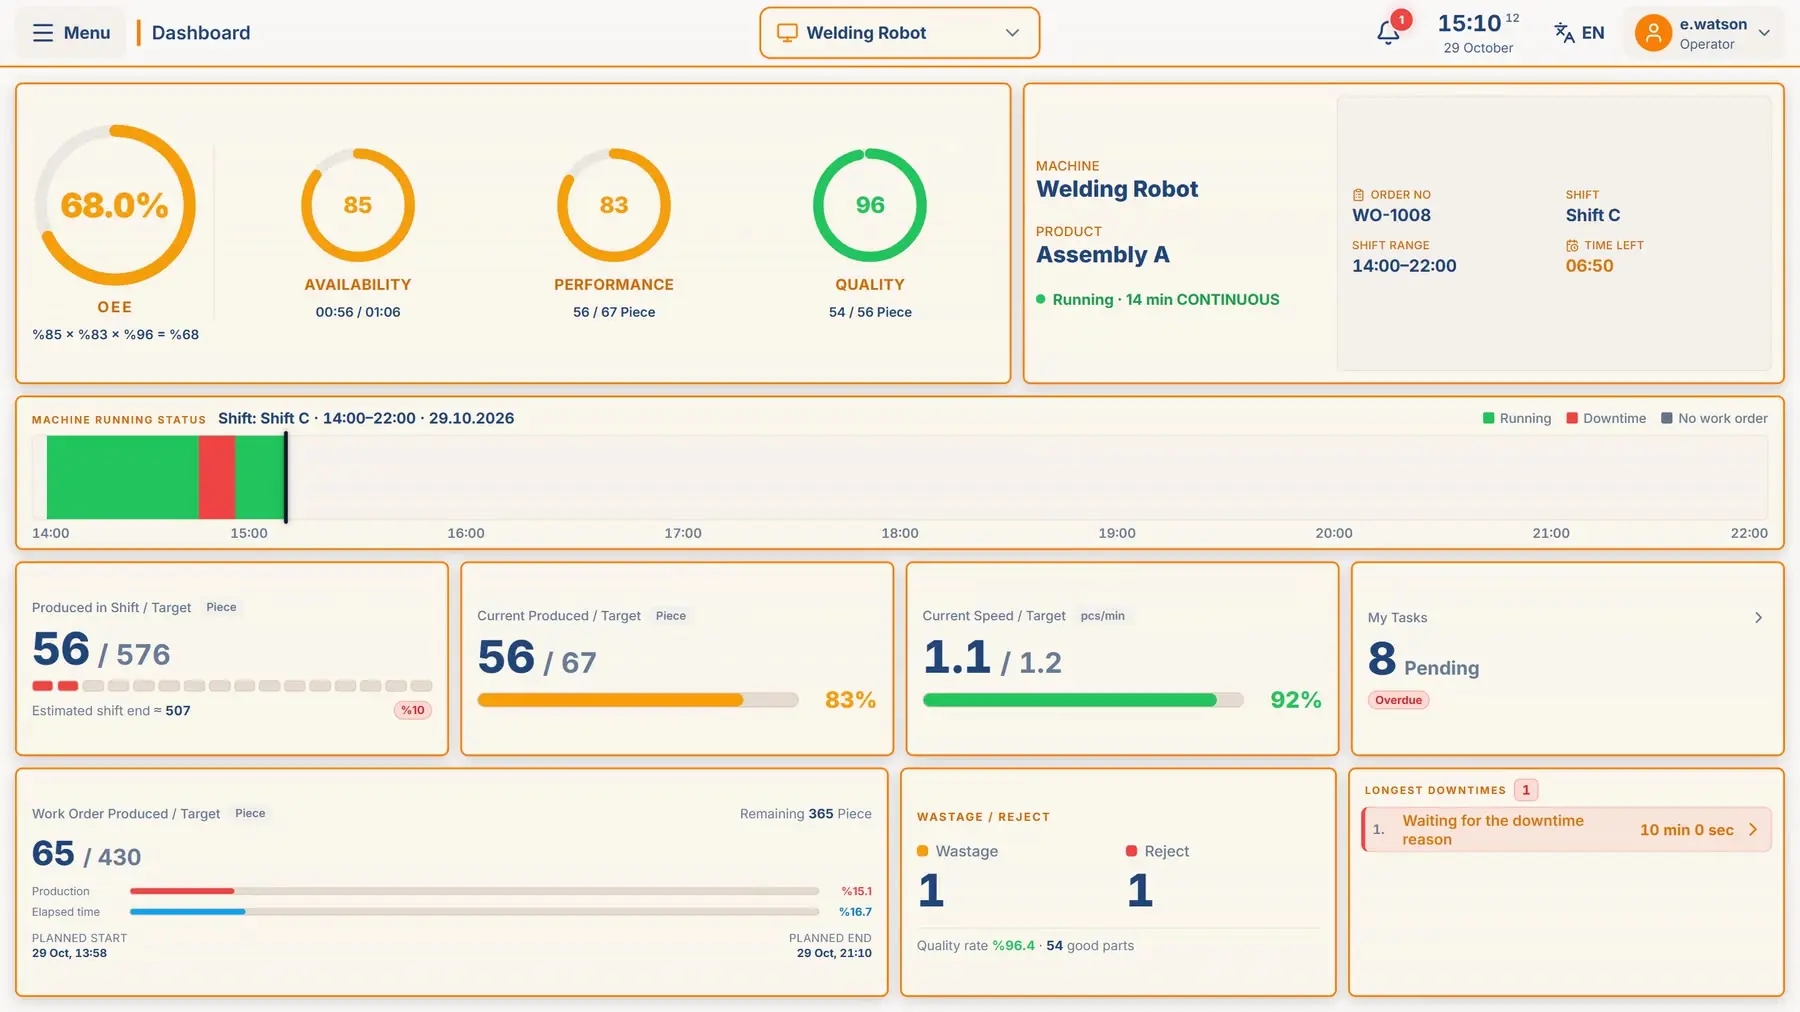
Operator kiosk
Live demo- Live OEE
- Work order
- Shift target
- Wastage
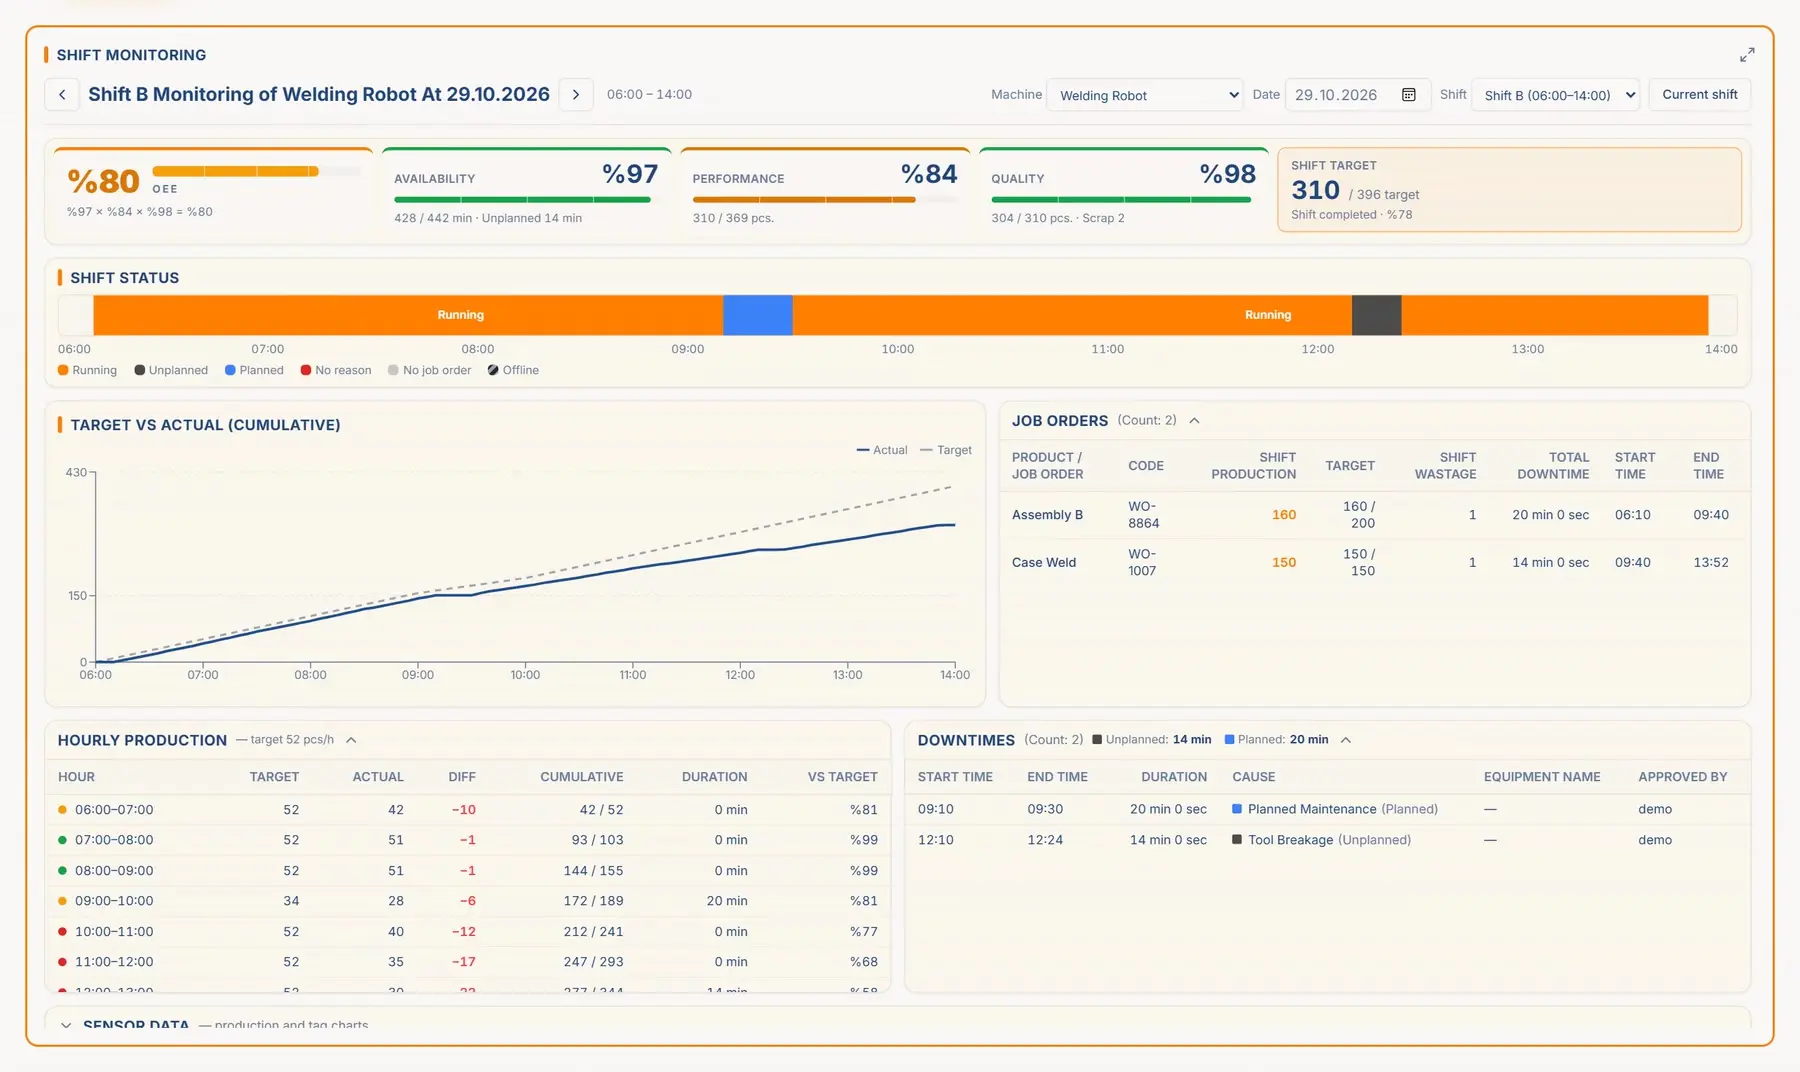
Shift monitoring
Live demo- Target vs actual
- Hourly production
- Stops by cause
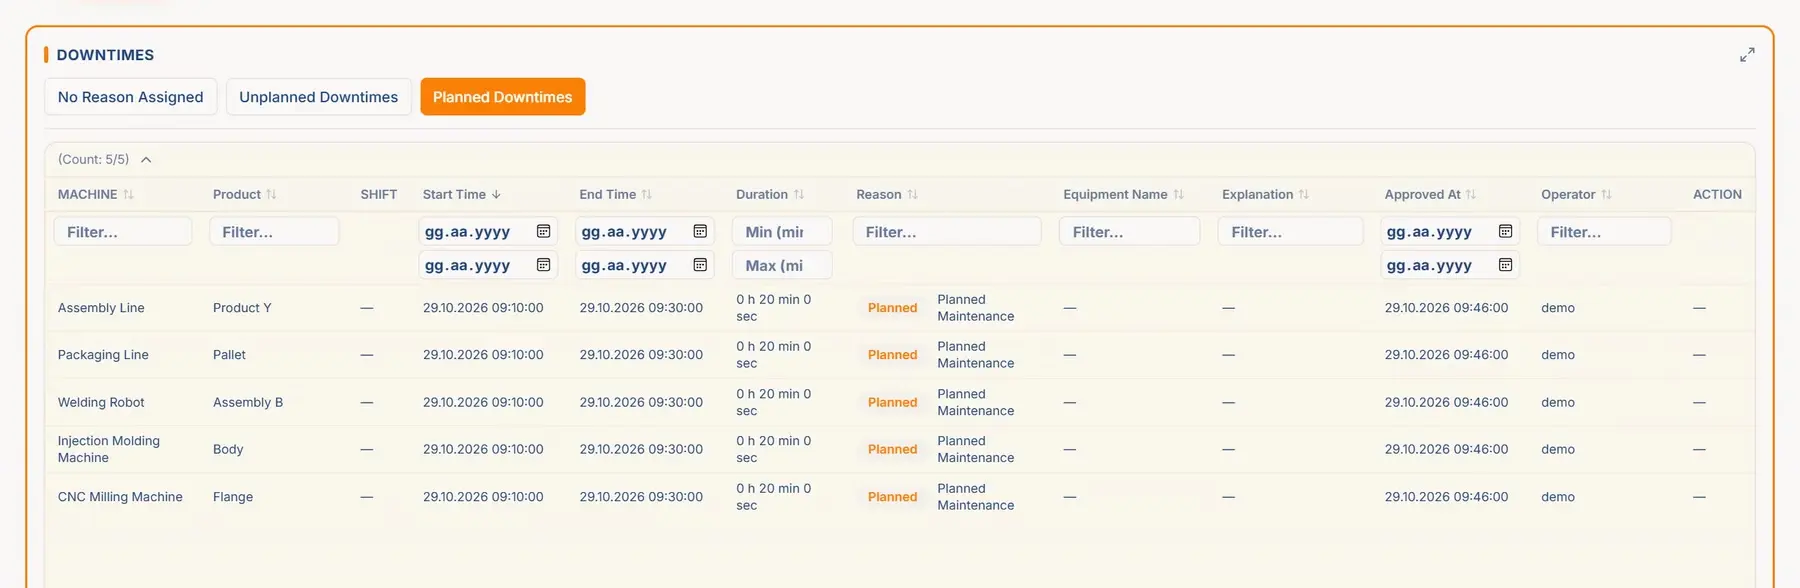
Downtime reasons
Live demo- Unassigned stops
- Planned · unplanned
- Approval
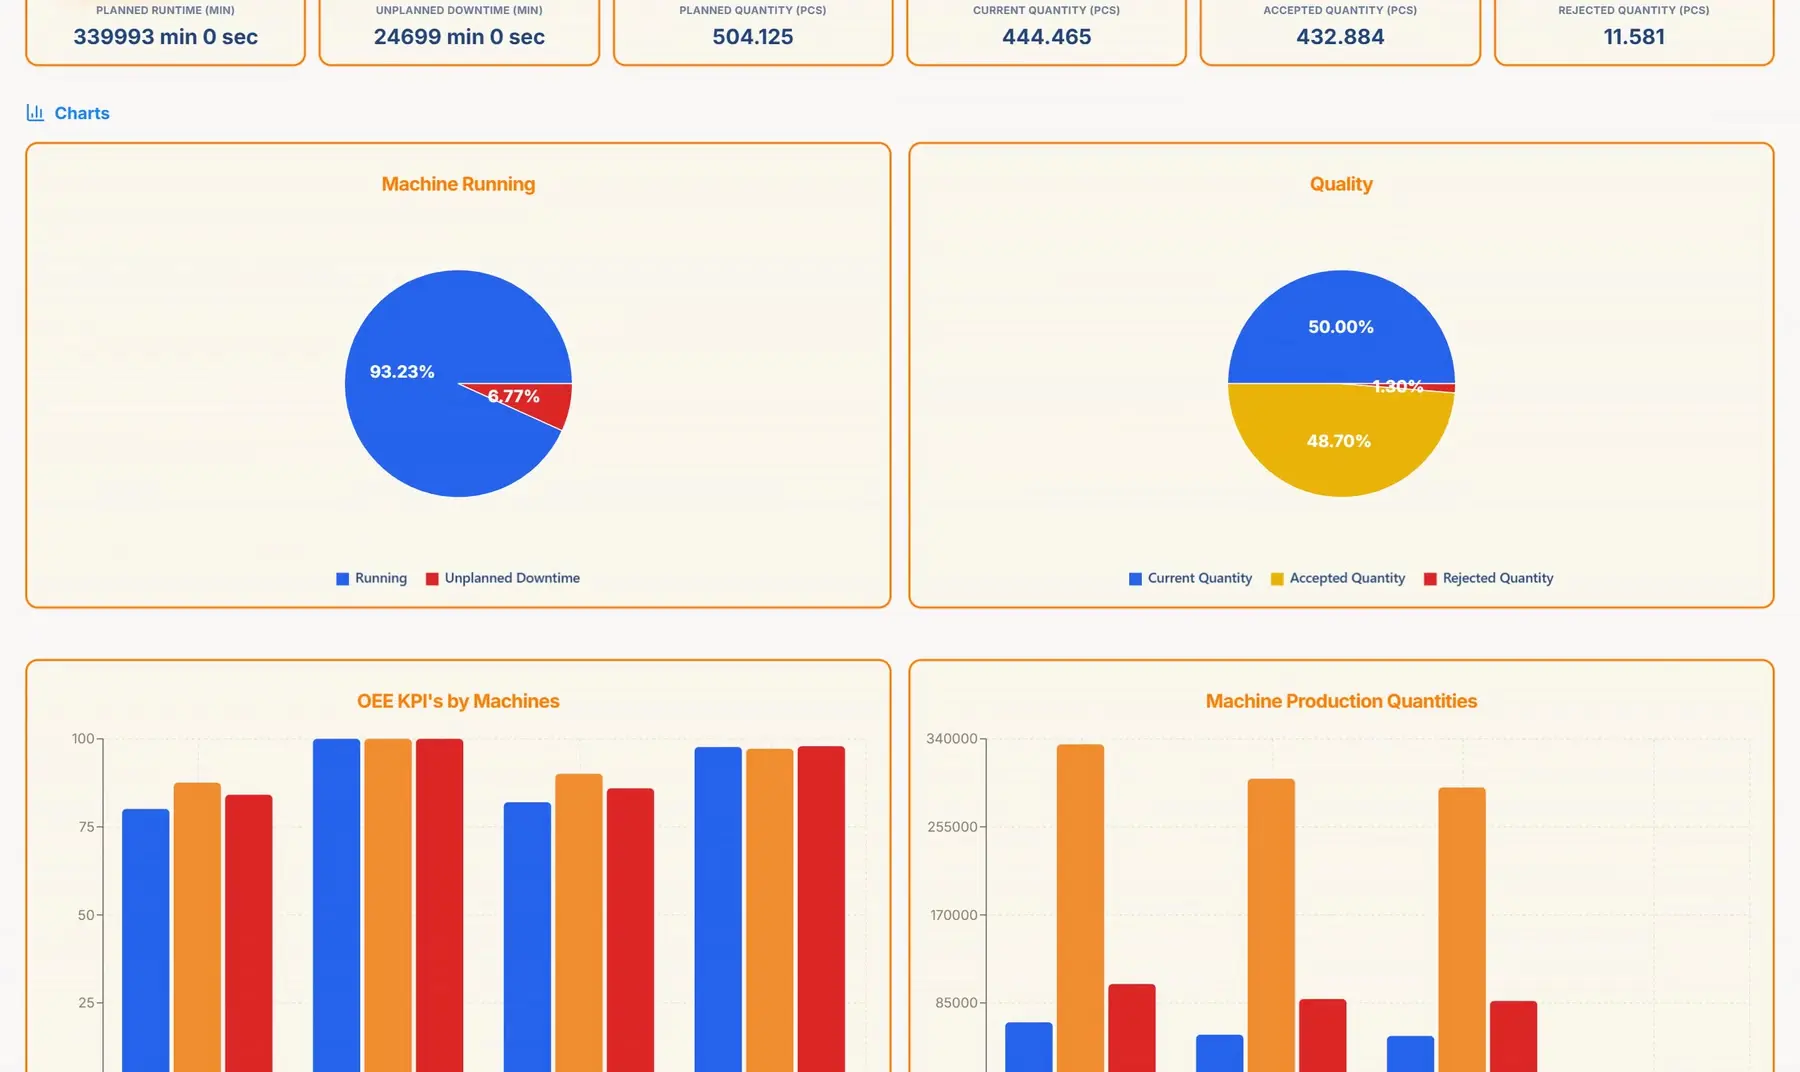
Reports
Live demo- Up to 4 machines
- Period comparison
- PDF · CSV · Excel
OEE delivered by the people who build it
Proveris OEE is developed by GreenSoft. The engineers who set up your lines work next to the people who write the code, so your process shapes the product.
- 01
We build the software we deliver
When your process needs something Proveris does not do yet, it goes into the product itself instead of a spreadsheet next to it.
- 02
Numbers your team trusts
Counts and stops are checked against real production before go-live, so the first meeting is about losses, not about whether the data is right.
- 03
Built for the shop floor
Operators see their machine on a kiosk and assign stop reasons with a tap. A phone pointed at the machine’s QR code shows its OEE on the spot.
- 04
Start with one line, grow from there
Begin with the line that matters most, prove the gains, then add machines, lines and plants to the same system.
Questions before a project
Usually not. Run and stop states, part counts and rejects are read from the controllers and sensors already on the machines. Where a machine has no usable signal, a simple sensor is enough. We check this machine by machine in the assessment.
Tell us about your lines
Share how many machines you run and how you track stops today. An engineer will get back to you with questions and a first proposal.
- Number of lines and machines
- Controllers or sensors on the machines
- Your shift plan
- How stops are recorded today