



1. GETTING STARTED
Logiphase® EMS is a web-based energy management system. It reads your energy analyzers in real time and brings consumption, power quality, alarms, reactive energy and cost together on screens your energy team can open from any modern browser.
This guide explains every module of the application, from the dashboard to the configuration pages, so operators, engineers and administrators can use it day to day.
1.1 Signing In
Open the address of your Logiphase server in the browser (the connection is HTTPS). Enter your user name and password and select Sign in. View Live Demo opens a demonstration session with simulated analyzers, without credentials.
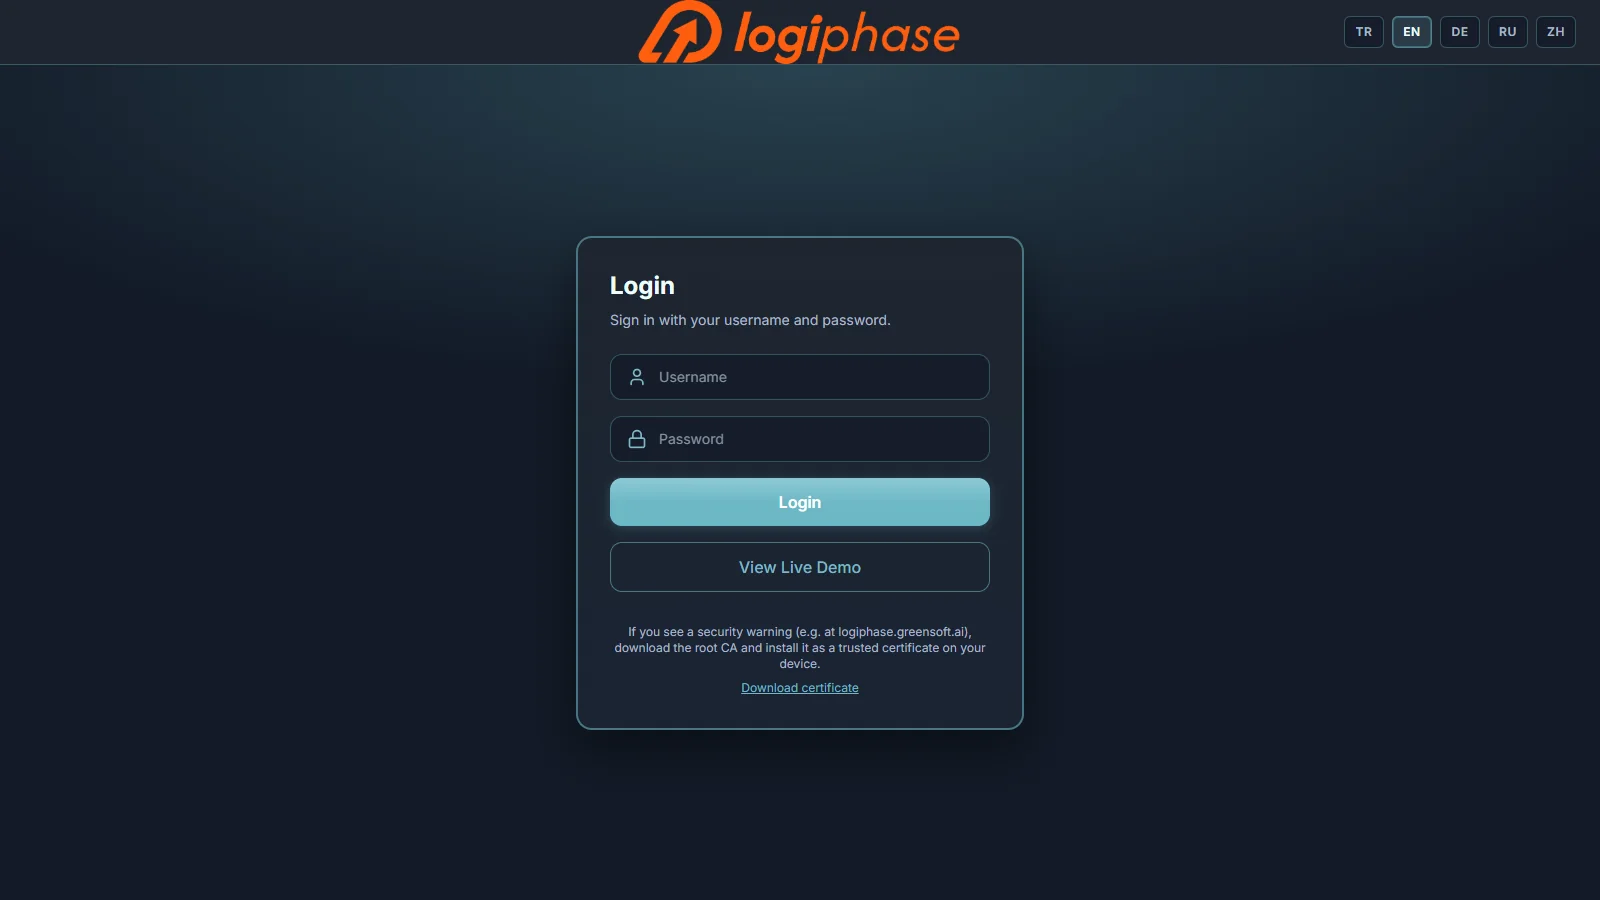
Use Logout in the top bar to end the session.
1.2 The Interface
The sidebar on the left lists the modules; the top bar shows the current date and time, the session and the full-screen controls.
Dashboard: site-wide power, energy, alarms, top consumers, grid measurements and sustainability indicators.
Analyzers: every energy analyzer with its status and measurements.
Line Diagram: the communication topology of gateways, switches and analyzers.
Visualization: SCADA screens such as single-line diagrams, with live values.
Reactive Watch: inductive and capacitive ratios against the penalty limits.
Live Monitoring and Live Tags: real-time values by device.
Trend Graphic and Benchmark: history and comparison of analyzers.
Alarms and Reports: alarm handling and tag, alarm and event logs.
Development and Settings: project, devices, connections, alarm definitions and tariff.
1.3 Language and Theme
Open Language at the bottom of the sidebar to switch between English, Turkish, German, Russian and Chinese. Theme offers Default, Ocean, Forest, Slate and Rose; the theme colours the sidebar, cards, charts and the sign-in page. Both choices are remembered by the browser.
1.4 Full Screen and Kiosk View
Monitoring pages can be opened full screen or in a new tab for control-room displays. In kiosk view, press F10 to hide or show the header.