

GreenSoft Migrated Forschner Turkey’s 17-Analyzer Energy Infrastructure into SCADA with a Single-Line Diagram
From the transformer substation and generator to the power factor correction panel and dozens of distribution panels, the whole electrical infrastructure of the plant is now monitored from a single screen.
Forschner Turkey is an international manufacturing facility in Kıraç, Istanbul, producing wiring systems for the automotive sector. The plant runs on a complex electrical infrastructure: a transformer substation, a generator, a power factor correction panel and dozens of connected distribution panels. GreenSoft brought all 17 analyzers covering this infrastructure into a single SCADA system, with real-time energy monitoring and a complete single-line diagram.
The challenge
The plant’s distribution network extends from the transformer and generator to the power factor correction panel, and an analyzer measures every point phase by phase.
In the existing setup, operators had to consult the analyzer screens panel by panel. The overall energy balance, the load distribution and possible fault points could not be seen as a whole, and physically reaching some panels took time, which made immediate intervention difficult.
The goal was to normalize current, voltage, active power, reactive power and power factor from every panel and build an intuitive SCADA interface where operators can follow the facility’s electrical status on a single screen, in real time.
What we did
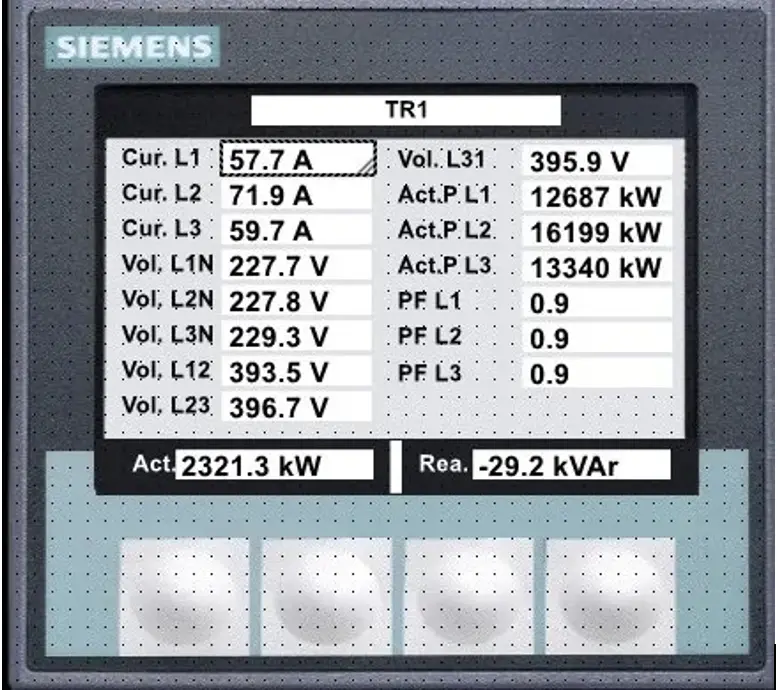
GreenSoft connected all 17 analyzers to the SCADA system over Modbus TCP. For each analyzer, the L1, L2 and L3 currents, the phase-neutral and line voltages, the active power per phase, reactive power and power factor were individually tagged and normalized.
The SCADA platform’s built-in JavaScript engine processes the raw data, calculates total active and reactive power, phase imbalance and power factor, and drives the color changes on the diagram. Breaker and disconnector states are reflected in real time, without any external software.
A live single-line diagram
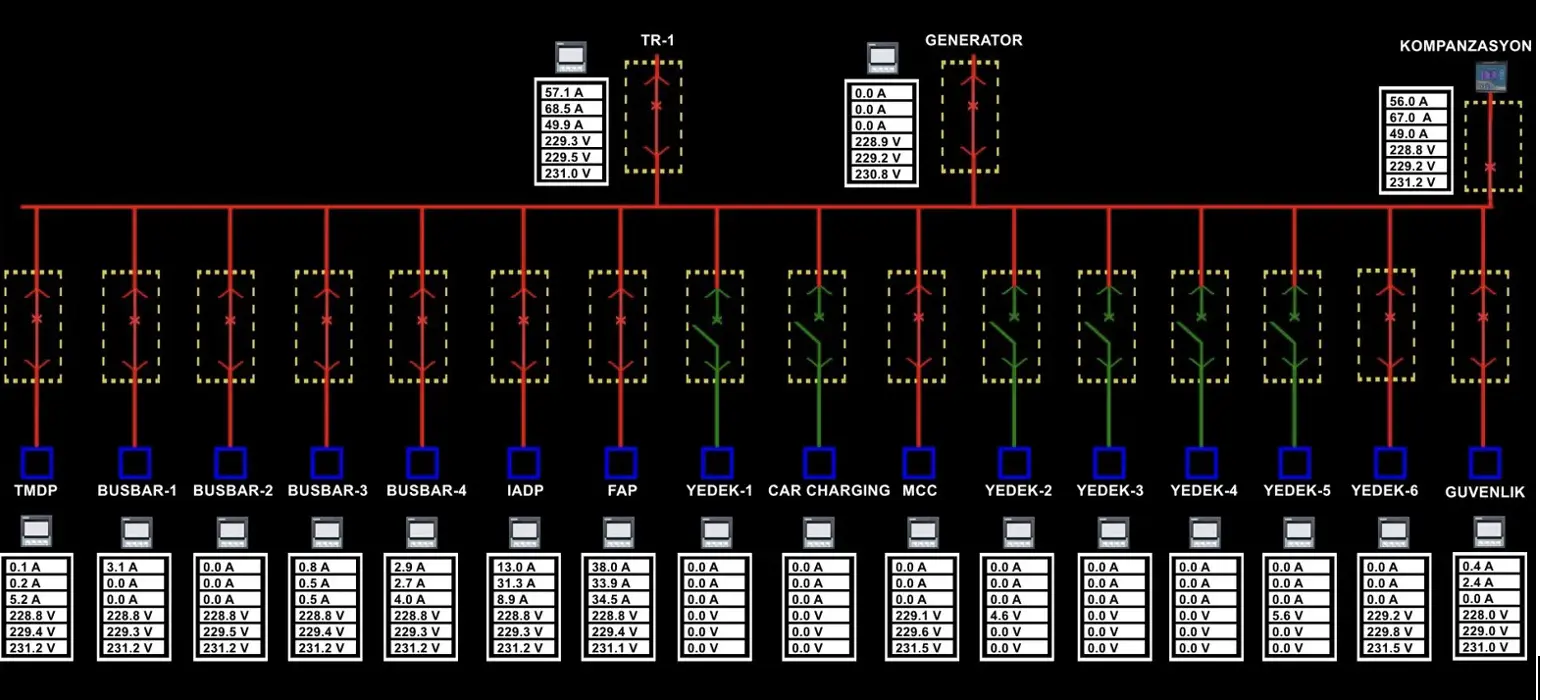
The most important deliverable is a dynamic single-line diagram that accurately reflects the facility’s electrical architecture. Every circuit breaker and disconnector shows its real-time state: active circuits are drawn in red, standby circuits in a different color, and each panel’s analyzer values appear in the box beside it.
The transformer is monitored as the main power source, the generator as the backup that starts during grid outages, and the power factor correction panel as the compensation system behind the plant’s power quality.
In traditional SCADA projects a single-line diagram is often just a static background image. Here it is fully dynamic, so when an anomaly occurs, operators see it as a change of color and know which panel or line is responsible simply by looking at the screen.
“The single-line diagram is no longer just a drawing — it’s a live electrical map of the facility.”
The result
After commissioning, Forschner Turkey’s energy management team could see electrical data from all 17 points of the facility on a single screen for the first time. Which panel’s power factor is falling, which circuit is overloaded and whether the generator has started are now visible in real time.
Power quality is tracked systematically as well: the effectiveness of the compensation system, line-based load imbalances and sudden load increases caused by the electric vehicle charging stations.
Operators are alerted the moment power, current or voltage thresholds are exceeded, with the full alarm history kept on record. On-site operators use the desktop application, while managers open the same system in a web browser.
What’s next
The project will grow on the same infrastructure. New production areas and distribution panels can be added to the same SCADA architecture as they are commissioned, and energy consumption reports, shift-based analyses and machine-learning-supported anomaly detection are on the roadmap.
Other projects we delivered

Your plant could be our next case study
Tell us what you run today and what you want to see on screen.