
GreenSoft Brought Pecasan’s Cardboard Angle Profile Machine into SCADA with a Real-Time OEE Dashboard
Pecasan makes honeycomb panels, paper pallets and cardboard angle profiles from 100% recyclable materials. Its angle profile machine now shows how effectively it runs, second by second, on a shop-floor dashboard.
Pecasan (Peca Dekor Panel San. ve Tic. A.Ş.) is a manufacturer of sustainable packaging based in Gümüşova, Düzce, founded in 2018 by partners with decades of industrial experience. It produces honeycomb panels, paper pallets, crates and separators, and cardboard angle profiles that protect goods during storage and shipment, all from 100% recyclable materials.
The challenge
The cardboard angle profile machine is at the heart of production. It forms and cuts profiles to the lengths customers order and runs continuously, yet the numbers behind that production were largely invisible.
How long the machine ran in a shift, how long it stood still and how many profiles met quality requirements had to be collected manually or estimated afterwards. Efficiency losses went unnoticed until the end of the shift, and planned versus actual output could not be compared in real time.
For a company built on sustainability, scrap mattered beyond cost: every rejected profile is wasted raw material, even when it is recyclable.
What we did
GreenSoft connected the machine’s existing PLC to SCADA over TCP and read four basic signals: belt speed in m/min, the number of profiles produced, the length of the current profile in mm, and a live running / stopped status.
Every other value is derived from these four signals. Speed and product length give the planned production; total, run and stop times come from the machine status. Availability, Performance and Quality are then combined into OEE (A × P × Q) in the platform’s built-in JavaScript module, and the results are stored in a database.
Each value drives its own gauge with several fill levels, and the machine status light changes color automatically with its tag value. All calculations run inside the platform, so no external software is needed.
A live OEE dashboard
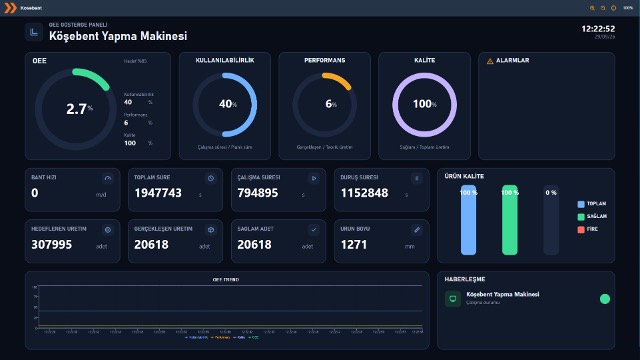
The core deliverable is a 1920×1080 OEE dashboard designed for large shop-floor displays. It uses a dark, card-based layout: labels stay quietly in the background, while the values operators act on are large and bright, and each OEE component keeps the same color on its gauge and its trend line.
The screen shows OEE against its target with separate Availability, Performance and Quality gauges; production figures such as belt speed, run and stop time, planned and actual production and good parts; total, good and scrap output side by side; a shift-long OEE trend; and the active alarm list with a live machine status.
“OEE is no longer a report read the next morning — it’s a live signal on the shop floor.”
The result
In many plants OEE is a number calculated after the fact from spreadsheets and shift reports. At Pecasan it became a live signal: the gauges move as the machine runs, and a drop in any component shows up on the screen immediately.
When OEE falls, operators can see at once which pillar is responsible — availability because of a stoppage, performance because of reduced belt speed, or quality because of rising scrap — and act during the shift rather than after it.
The collected data gives Pecasan a reliable foundation for continuous improvement: the team can pinpoint the largest sources of loss, reduce material waste and measure the impact of every change on the line, supporting both productivity and its sustainability goals.
What’s next
In the next phase, the other machines in the factory will be integrated into the same system in the same way as the angle profile machine.
Other projects we delivered
Your plant could be our next case study
Tell us what you run today and what you want to see on screen.