User Interface
5. USER INTERFACE
The Proveris® OEE user interface is designed to effectively manage industrial automation processes. It features an accessible and user-friendly structure, incorporating modern visual and functional components that facilitate user interaction with the system. Tools have been developed to optimize the user experience and minimize challenges. The interface includes the following panels: Project Explorer, Workspace Area, Toolbar, Properties Window, and Status Bar. These panels can be hidden as needed.
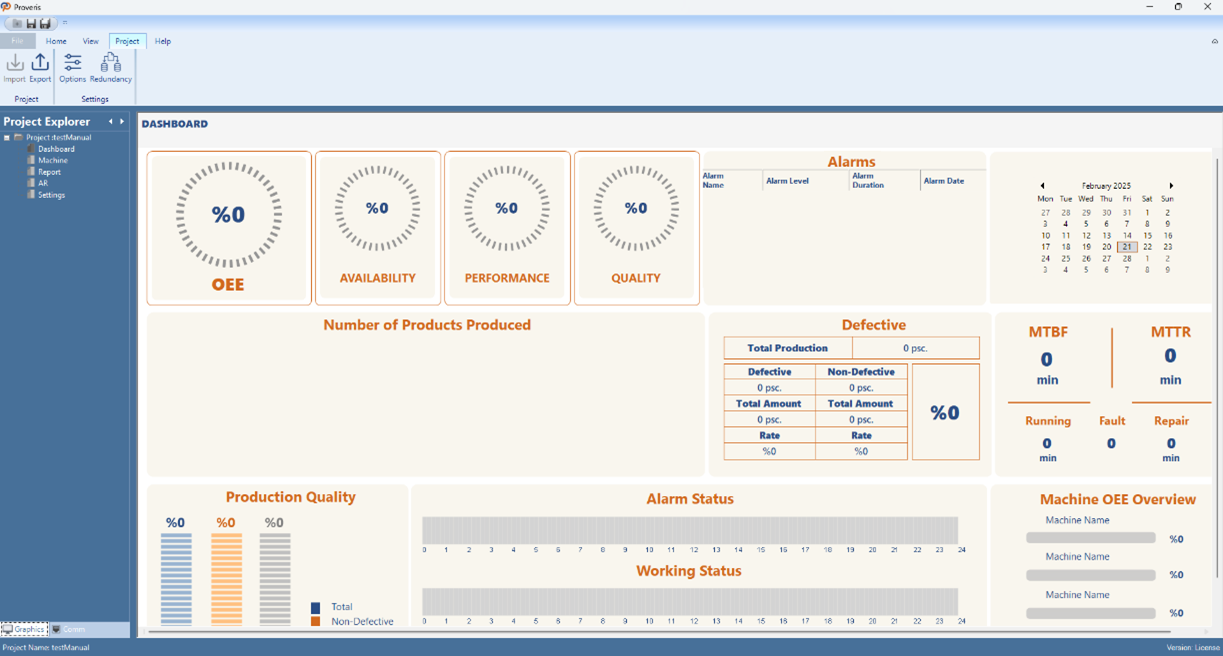
Figure 132 – User Interface
5.1 Project Explorer
The Project Explorer is a panel in Proveris® OEE that displays the entire project structure, providing quick access to OEE pages.
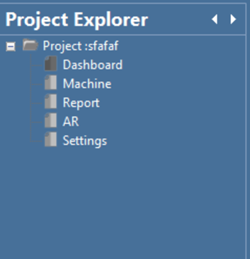
Figure 133 – Project Explorer Graphics Menu
5.1.1 Dashboard
This section provides an overview of the main dashboard screen of the OEE system. Through this panel, users can monitor real-time data during system runtime, track live changes in the production process, and instantly view updates in OEE indicators.
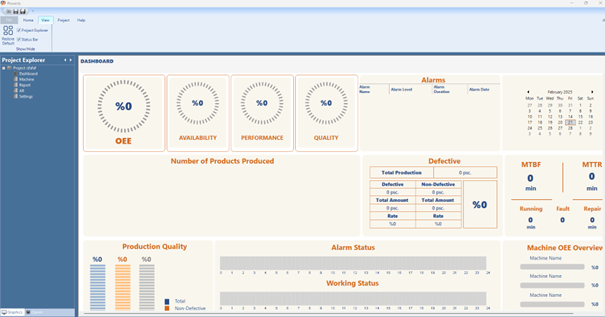
Figure 134 – Dashboard Screen
5.1.2 Machine
In this section, the information of the machine to be monitored is entered into the system. When the "+" button below the "Add Machine" title on the Machine page is clicked, a popup window appears for entering machine details.
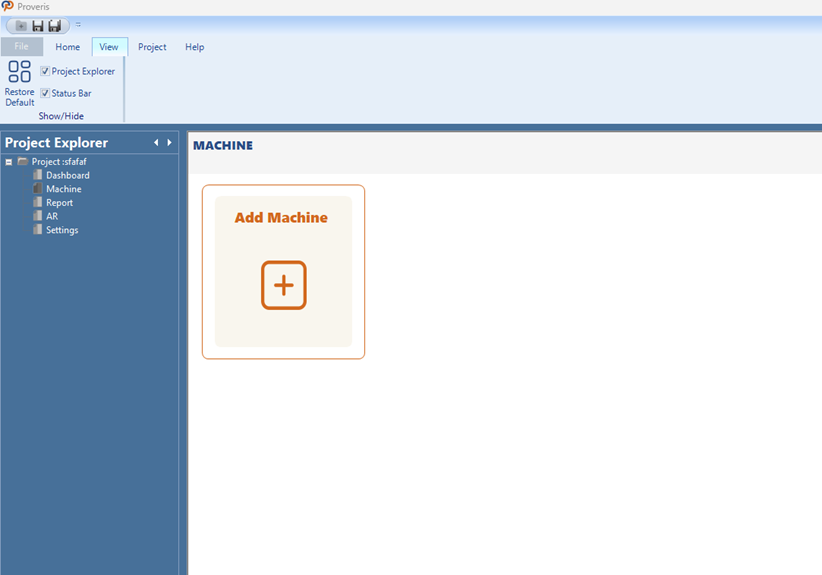
Figure 135 – Machine Screen
In the popup window, the machine name (Machine Name) and the ideal production quantity (Ideal Production Quantity [min/piece]) are entered. These values serve as key parameters for OEE calculations.
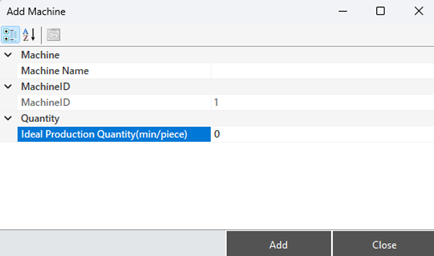
Figure 136 – Creating a Machine
After adding a machine, right-clicking on the machine name box (after a single left-click selection) opens a context menu with the following options:
Rename Machine
Add Machine
Delete Machine
These options allow the user to add a new machine, rename the selected machine, or remove it from the system.
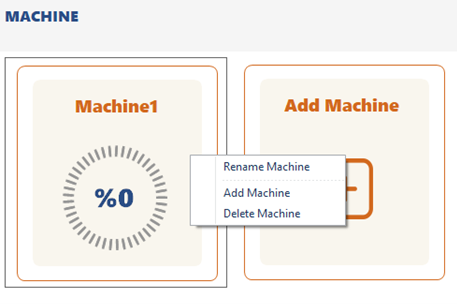
Figure 137 – Machine Operation Options
Rename Machine
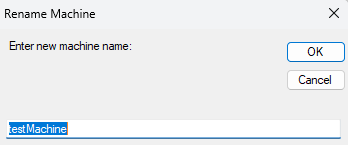
Figure 138 – Rename Machine
When the Rename Machine option is selected, a popup window appears allowing the user to enter a new machine name.
After typing the new name, clicking the OK button will change the machine’s name, while clicking Cancel will abort the process.
5.1.3 Report
On this screen, users can select specific parameters to view and analyze machine performance data,and export the results in PDF, CSV, or XLS formats.
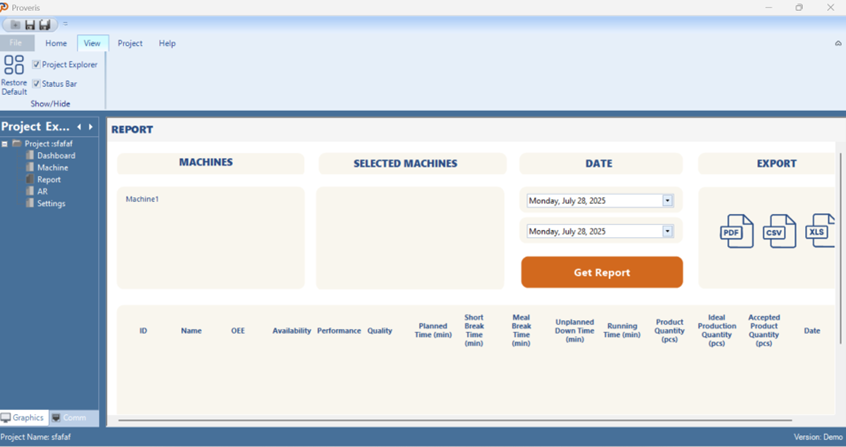
Figure 139 – Report Screen
Machines can be selected from the Machine List, and the chosen machines are displayed under the Selected Machines section for confirmation. Then, the desired date range is set, and the Get Report button is clicked.
Once clicked, the data is visualized in a new popup window. Additionally, the filtered data can be reviewed in table format through the DataGridView located at the bottom of the report page.
The data shown in the DataGridView can be exported by clicking the PDF, CSV, or XLS buttons, allowing users to download the report in their preferred format.
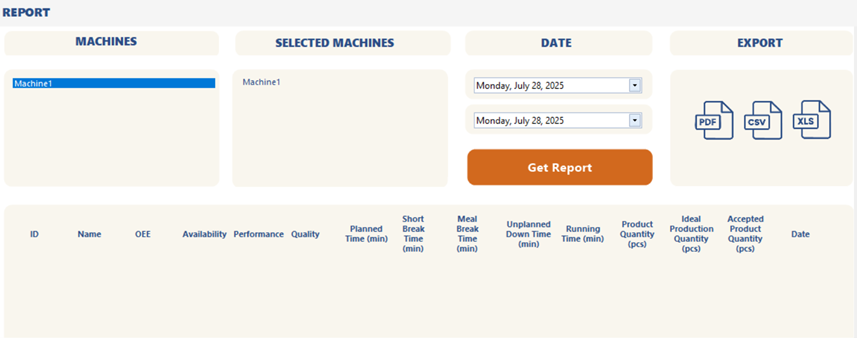
Figure 140 – Report Parameters and Export Options
5.1.4 AR
The AR page functions as a preview screen similar to the Dashboard page. When the system is running in runtime mode, pressing the ON button activates the Augmented Reality (AR)functionality.
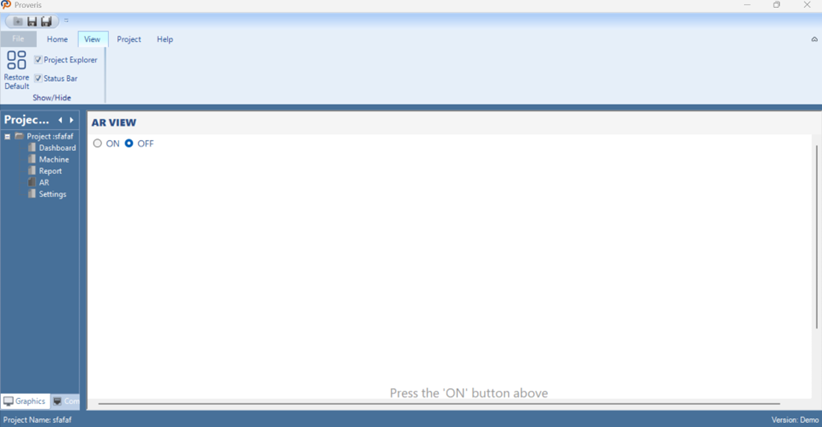
Figure 141– AR Screen
5.1.5 Settings
The Setting page is a configuration screen where machine-specific data required for the proper operation of the system can be entered and modified.
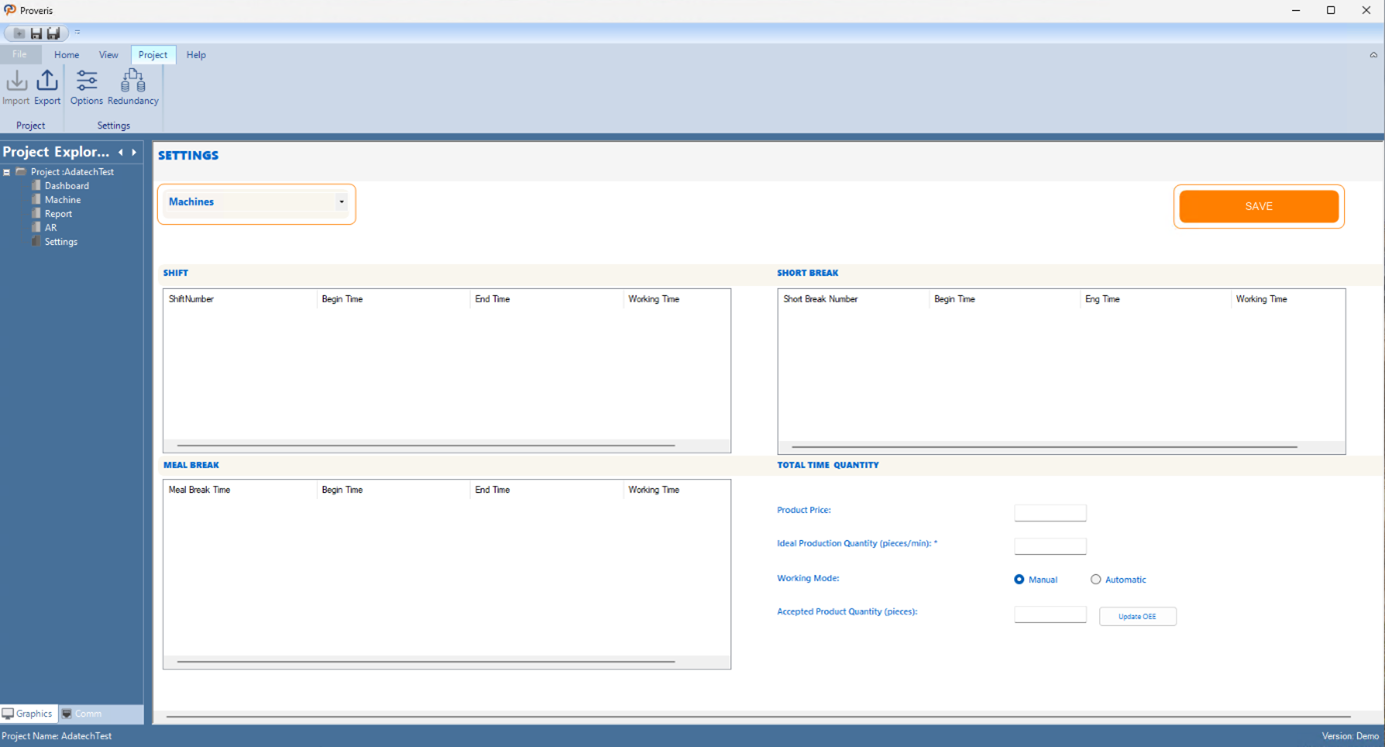
Figure 142 – Settings Screen
First, the desired machine must be selected from the ComboBox at the top. Then, by right-clicking on the Shift, Short Break, or Meal Break lists, a popup menu appears where users can define the date range and time intervals for each item and existing entries can be deleted by right-clicking on them and selecting the Delete Selected Shift, ShortBreak and MealBreak option.
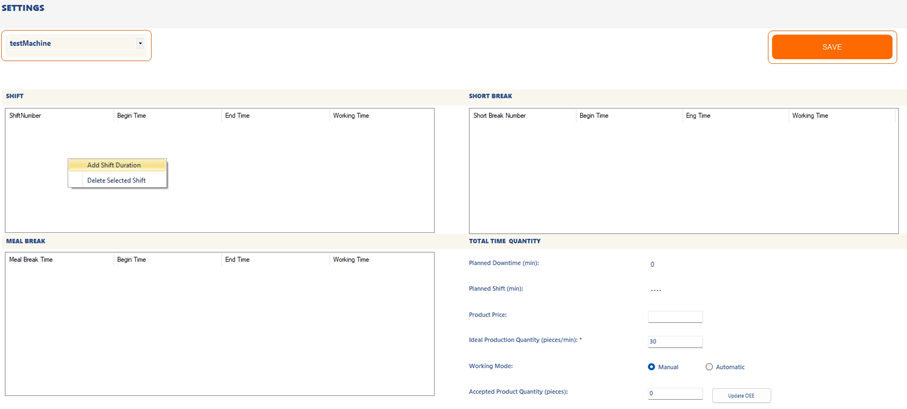
Figure 143 – Creating a Shift, Short Break or Meal Break
First, the date range for the data to be added must be selected. Then, within the selected dates, the specific time intervals during which it will be valid must be specified.
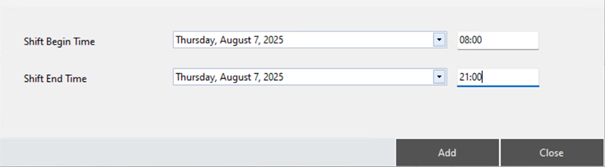
Figure 144 – Creating a Shift, Short Break or Meal Break
Next, in the bottom-right section of the page, users must enter the unit price of the planned product and the target production quantity per minute. These values serve as key inputs for performance analysis and production cost calculations within the system.
Finally, our system tracks the number of accepted products using two methods: Manual and Automatic. The Working Mode setting can only be modified through the Editor Interface. This selection is not allowed in the Client interface.
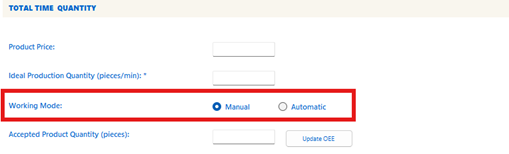
Figure 145 – Choosing Working Mode
In the Manual method, the user enters the number of accepted products manually at the end of a shift or workday. This is done by entering a value into the Accepted Product Quantity field, then clicking the Update OEE button to complete the process. This data can also be entered while the system is running in runtime mode.
In the Automatic method, the system requires an additional sensor to automatically detect correct products. With this setup, the system can distinguish between good and defective units in real time and log the data accordingly. In the Automatic method , Update OEE button is disabled and cannot be used.
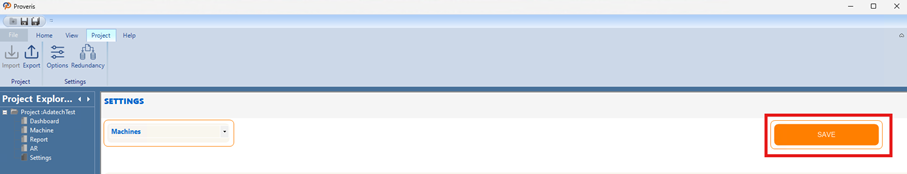
Figure 146 – Save Button
After making any changes, the Save button must be clicked to apply them.
5.2 Status Bar
The Status Bar is located at the bottom of the Proveris® OEE interface and displays the project name and license status.
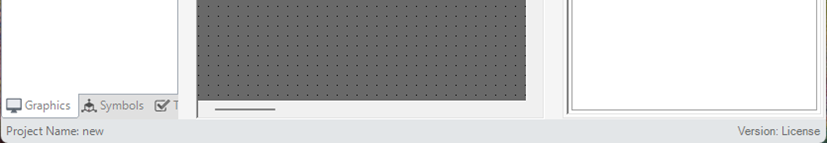
Figure 147 – Status Bar