Client Editor
10. CLIENT EDITOR
10.1 Login
When ProverisClient.exe is launched, the Login screen is displayed first. On this screen, the Username and Password defined in the Users section of the Editor page must be entered, along with the IP address and Port where the server is running.
Once the entered credentials are verified on the ServerEngine , the Proveris Client interface loads and the system becomes ready for use.
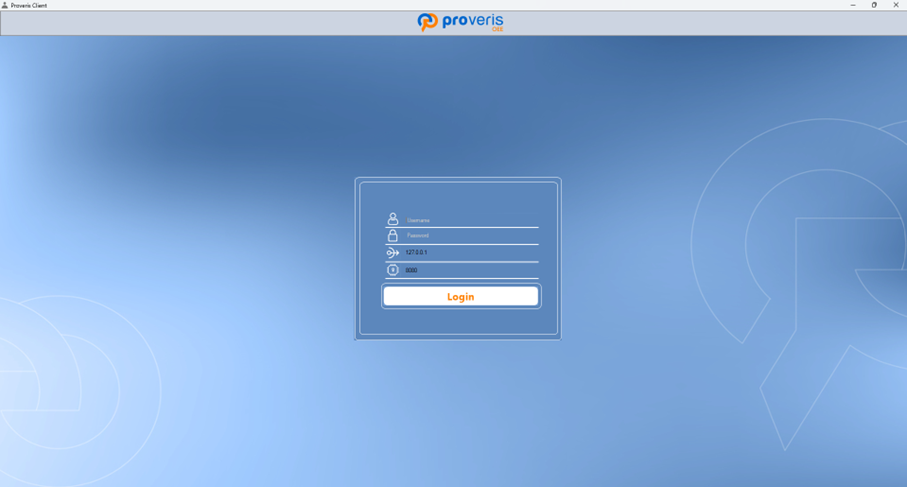
Figure 172 – Login Page
10.2 Dashboard
When Proveris® Client is launched, the Dashboard screen is displayed first. If the date selected in the calendar is the current day and the system is running, the charts are automatically recalculated based on incoming real-time data. If a past date is selected, the Dashboard displays the recorded data for that specific day.
As shown in Figure 1.11, the buttons located at the top of the screen provide quick access to different modules:
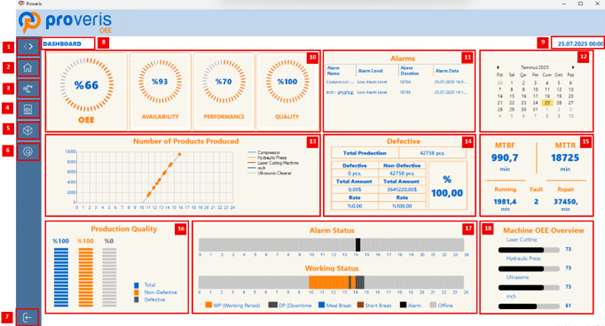
Figure 173 – Client Dashboard Component
No | "Name" | This is the label information field |
1. | “Show/Hide Button” | Opens menu and displays icons with their labels or their labels. |
2. | "Dashboard Button" | Displays the Dashboard page, which is shown by default on startup. |
3. | "Machines Button" | Opens the Machines page. |
4. | "Report Button" | Opens the Report page. |
5. | "AR View Button" | Opens the AR View page. |
6. | "Settings Button" | Opens the Settings page. |
7. | "Machines Button" | Defines whether the filter should be applied to values inside or outside the specified range. |
8. | Page Name | Displays the name of the currently open page. |
9. | Selected Date | Shows the date selected from the calendar. |
10. | OEE, Availability, Performance, Quality Charts | Displays OEE, Availability, Performance, and @uality data in graphical form. The numbers in the center indicate the respective percentage values. |
11. | Alarm List | Displays alarm information from all machines in the system. |
12. | Calendar | Used to select a specific date. The data for the selected date is displayed on the dashboard screen. |
13. | Number of Products Produced | All machines are assigned different colors for easy identification in the chart. In the hourly time intervals shown on the chart, the values displayed on the left indicate the total number of products produced up to that specific hour. |
14. | Total Production | Displays the total production count, indicating how many are defective and how many are non-defective. Also shows the costs and percentage values for each category. |
15. | MTBF / MTTR | Shows MTBF (Mean Time Between Failures) and MTTR (Mean Time To Repair) values. Lists the total operating time of all machines, the total number of failures, and the total repair time for these failures. |
16. | Production Quality | Displays production quality. Shows the percentage of defective and non-defective products in three percentage columns. |
17. | Alarm/Working Status | Contains two time-based charts: Alarm Status shows the number of faults within specific time intervals for the selected calendar date (each bar represents 12 minutes). Working Status shows the time intervals during which the machine was operating. |
18. | Machine OEE Overview | Displays the top four machines with the highest OEE values among all machines. |
Table 31 – Client Dasboard Component
When the machine stops, an "Add Alarm" popup window appears, prompting the user to enter the Level of the Alarm. In the Alarm Level section, the severity is selected from the List.
In the Alarm Description section, two options are provided:
· Defined – select a predefined cause from the project's existing list.
· New – manually enter a custom description.
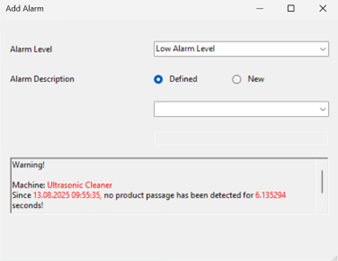
Figure 174 – Add Alarm Page
After specifying the details, click Add to create the alarm.Once added, the alarm is displayed in the Alarms List (11).
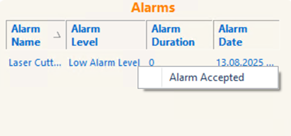
Figure 175 – Accepted Alarm on Alarms List
When an alarm is added, the Alarm Duration field initially displays "0", indicating that the alarm is still active.
Once the issue causing the alarm is resolved, the user navigates to the Alarms table, selects the resolved alarm, and right-clicks to choose Alarm Accepted.
After acknowledging the alarm, the Alarm Duration field updates to show how long it took to resolve the issue.
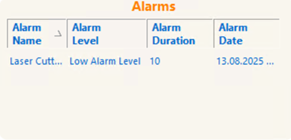
Figure 176 – Alarms List
10.3 Machine
On the Machines page, all machines are displayed within individual cards containing OEE, Availability, Performance, and Quality information. A new machine cannot be created on this page.
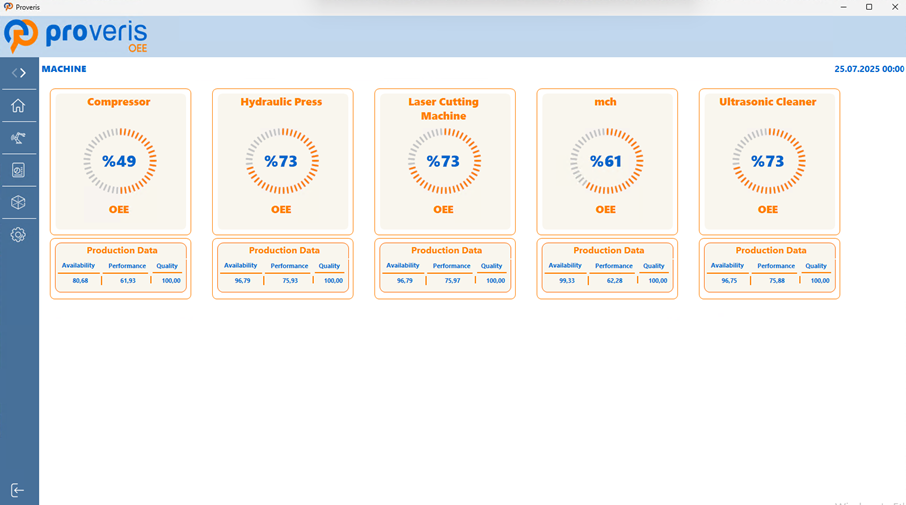
Figure 177 – Machine Page in Client
When the frame containing the machine name is clicked, a popup window opens, displaying data specific to that machine only.
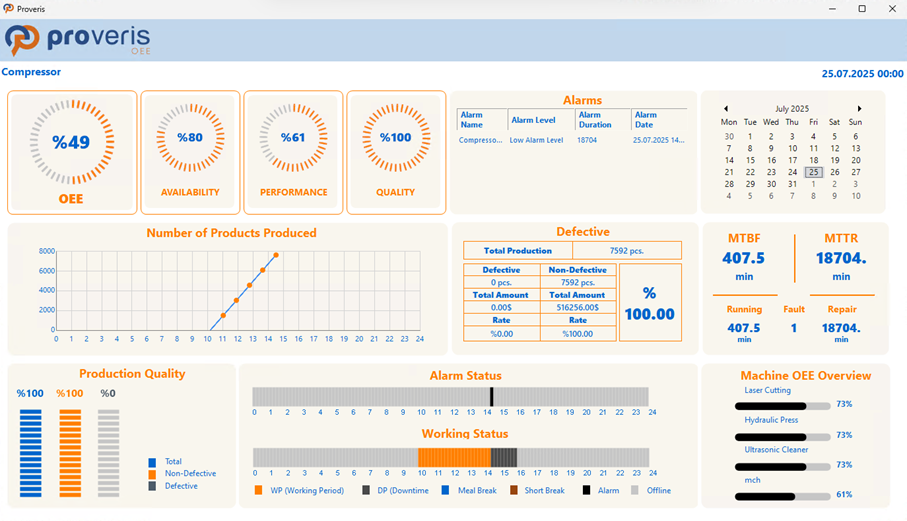
Figure 178 – Machine Dashboard
The name of the selected machine is displayed separately at the top-left corner of the dashboard screen. All alarm operations that can be performed on the Dashboard screen can also be carried out on the Machines page.
10.4 Report
On this screen, users can select specific parameters to view and analyze machine performance data,and export the results in PDF, CSV, or XLS formats.
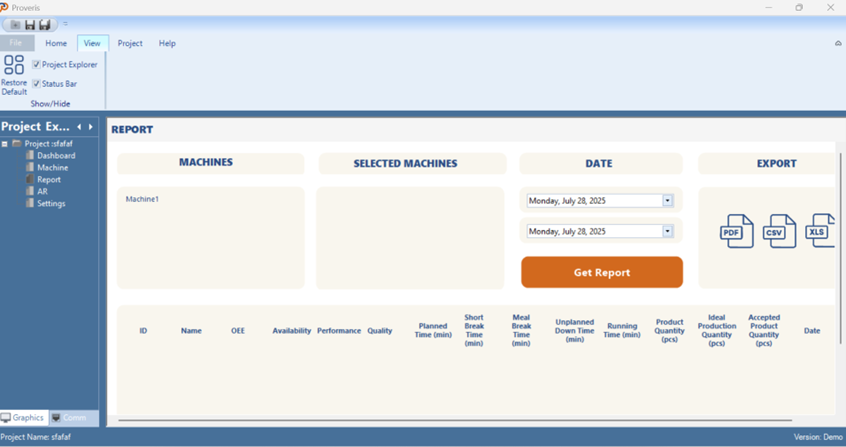
Figure 179 – Report Screen
Machines can be selected from the Machine List, and the chosen machines are displayed under the Selected Machines section for confirmation. Then, the desired date range is set, and the Get Report button is clicked.
Once clicked, the data is visualized in a new popup window. Additionally, the filtered data can be reviewed in table format through the DataGridView located at the bottom of the report page.
The data shown in the DataGridView can be exported by clicking the PDF, CSV, or XLS buttons, allowing users to download the report in their preferred format.
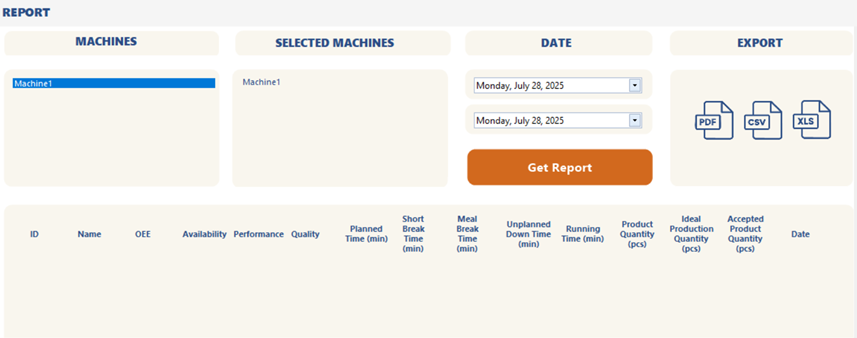
Figure 180 – Report Parameters and Export Options
10.5 AR View
In the AR View screen, when the On button is pressed, the selected camera starts capturing video. Once the camera detects the QR code placed on a machine, the real-time OEE, Availability, Performance, and Quality values of that machine are displayed on the screen.
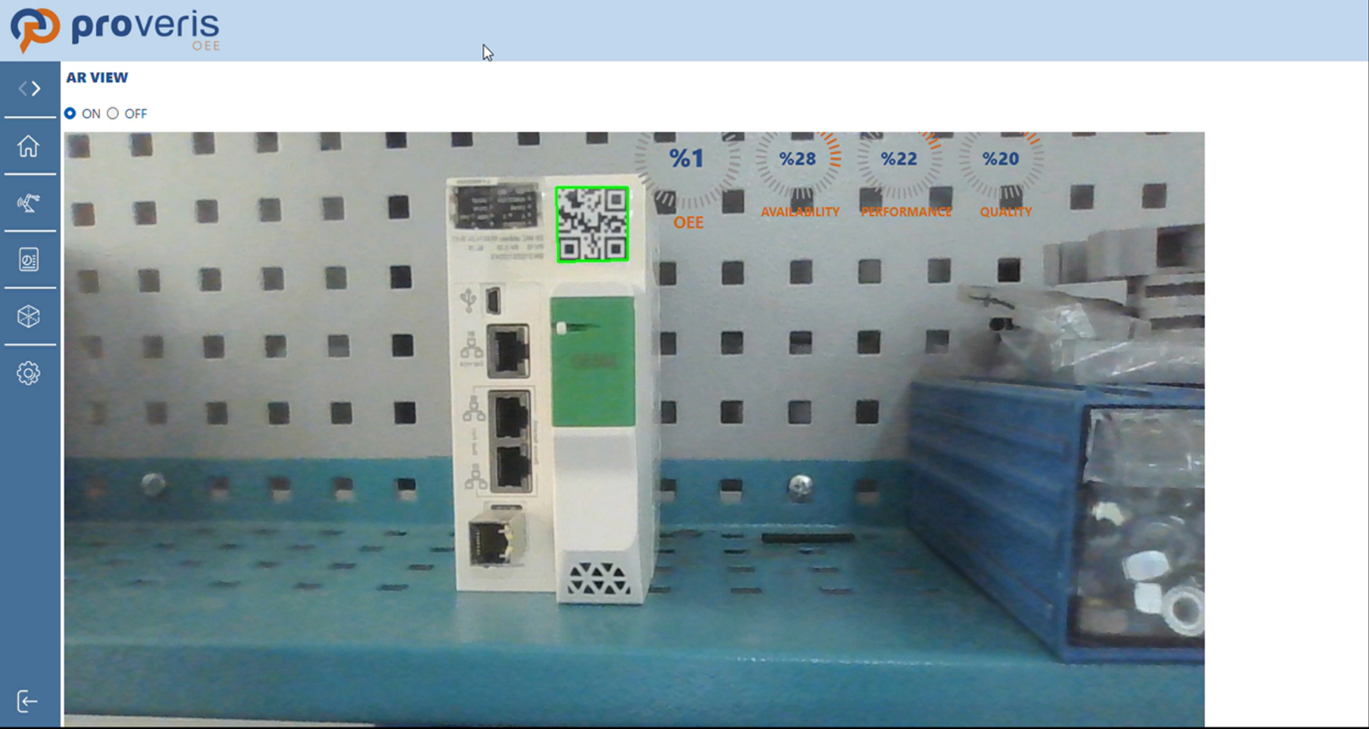
Figure 181 – AR
10.6 Settings
The Setting page is a configuration screen where machine-specific data required for the proper operation of the system can be entered and modified.
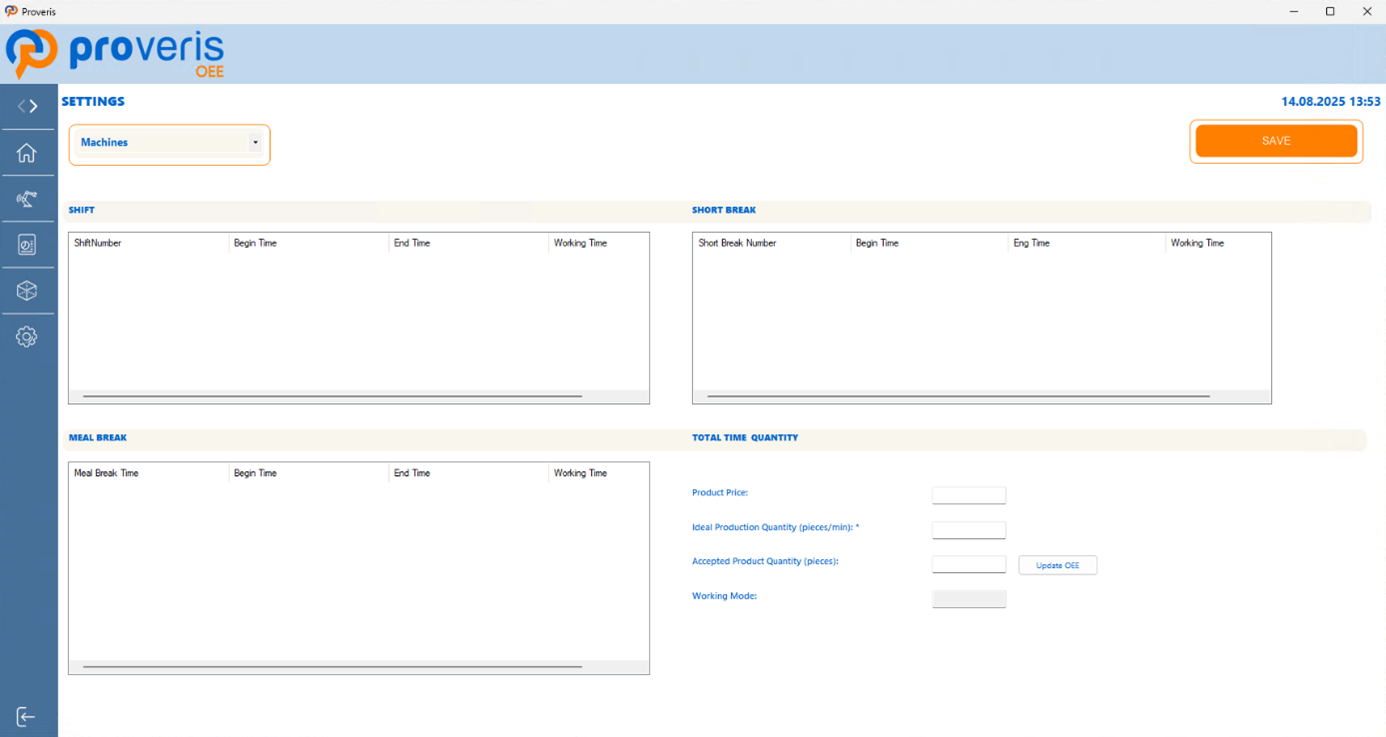
Figure 182 – Client Settings Screen
First, the desired machine must be selected from the ComboBox at the top. Then, by right-clicking on the Shift, Short Break, or Meal Break lists, a popup menu appears where users can define the date range and time intervals for each item and existing entries can be deleted by right-clicking on them and selecting the Delete Selected Shift, ShortBreak and MealBreak option.
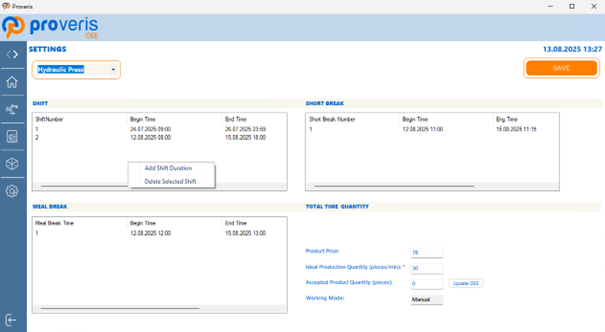
Figure 183 – Creating a Shift, Short Break or Meal Break in Client
First, the date range for the data to be added must be selected. Then, within the selected dates, the specific time intervals during which it will be valid must be specified.
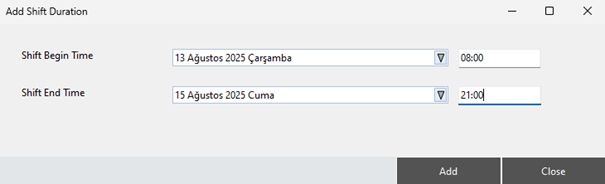
Figure 184 – Creating a Shift, Short Break or Meal Break In Client
Next, in the bottom-right section of the page, users must enter the unit price of the product and the ideal production quantity per minute. These values serve as key inputs for performance analysis and production cost calculations within the system.
Finally, our system tracks the number of accepted products using two methods: Manual and Automatic.
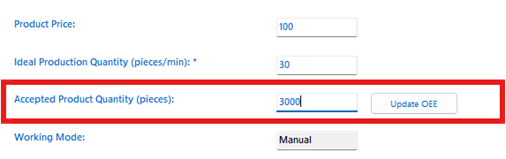
Figure 185 – Accepted Product Quantity Value in Manual Mode
If the Working Mode is set to manual, the user enters the number of accepted products manually at the end of a shift or workday. This is done by entering a value into the Accepted Product Quantity field, then clicking the Update OEE button to complete the process.
In the Automatic method, the system requires an additional sensor to automatically detect correct products. With this setup, the system can distinguish between good and defective units in real time and log the data accordingly. In the Automatic method, Update OEE button is disabled and cannot be used.